How It's Made
How Instacart Modernized the Prediction of Real Time Availability for Hundreds of Millions of Items While Saving Costs

This is Part 2 of a three-part blog post series in which we outline how we addressed inventory challenges through product, machine learning, and engineering innovations. See Part 1 here.
Introduction
At Instacart, we serve customers with a goal of finding and delivering all the products that they want to purchase from their favorite grocery stores. But this is no easy task as we described in Part 1. Inventory fluctuates at physical stores, and especially following the COVID pandemic, supply chains have been volatile. Therefore, predicting the inventory status of each product — in-stock, low stock, and out-of-stock — is a big challenge that we’ve taken on using machine learning.
We aim to provide our customers with up-to-date inventory predictions, so that they can expect to get what they order. Our community of shoppers scans millions of items per day and delivers them to the customers. Every time a shopper scans an item into their cart or marks an item as “not found”, we treat this as another signal that helps us make granular predictions of an item’s in-store availability. Sometimes when some items are low in stock, we communicate it with customers in the Instacart app (see Fig 1) so they can pick alternative products or choose replacements beforehand.

Within Instacart, an item is defined as a product within a particular store. We treat the same product sold in different stores as different items, because the same product may have different inventory status in each individual store.
Several years ago, Instacart built an item availability model that has since served as the basis of our approach to this challenge of scale. The model predicts the probability of finding an item in store, represented as a value between 0 and 1, for each item in our catalog. However, over the years, particularly during the pandemic period, we have identified some opportunities to improve the existing model, especially around better interpretability and modernizing the legacy infrastructure.
In order to support timely and informed shopping decisions and address the opportunities we have identified, we have built and deployed a new real-time item availability model. The new model has shown significant improvement in terms of business metrics and engineering performance.
Challenges with the previous model
Our previous model pipeline, shown in Fig 2, primarily focused on generating comprehensive features using our data warehouse, Snowflake, and was a batch scoring job which ran every 2–4 hours. The scope of the machine learning layer ended when the pipeline wrote to a Postgres database for scalable serving.

While the previous model delivered satisfactory results, there were still several newly arising challenges since the pandemic; we wanted to address them when we designed the new model and the serving pipeline.
Interpretability
The first challenge was interpretability, and it was particularly problematic when the model made a wrong prediction about an item actually in stock. We want to have a structured model so that its predictions are reliable, and easy to understand why it makes a particular prediction. This is important because the correct interpretation can prompt follow-up actions, such as making more observations in the store, or informing retailers to replenish.
Sparse Data
The second challenge was a sparse data problem. During the pandemic, our catalog grew several times larger than before, thanks to our continued catalog data work with our retailer partners. While we have millions of signals from Instacart shoppers who fulfill customer orders in store every day, our catalog size is hundreds times larger, so the majority of the items in our catalog have very limited or even no shopper signals. In order to still accurately predict the scores for the large number of tail items, we need to add and generate new features in a principled and reliable manner, and revisit some possibly less relevant and less useful features.
Business use case mismatch
The third challenge was the so-called “business use case mismatch”, with use cases shown in Fig 3. There are two major use cases: customers ordering (cart building, post check-out, etc) and shoppers picking up in stores. When the order time and picking time are relatively close (instant delivery), one set of scores is sufficient to support all stages of a shopping journey. However, since the pandemic, we have seen more diverse use case scenarios raising new challenges.
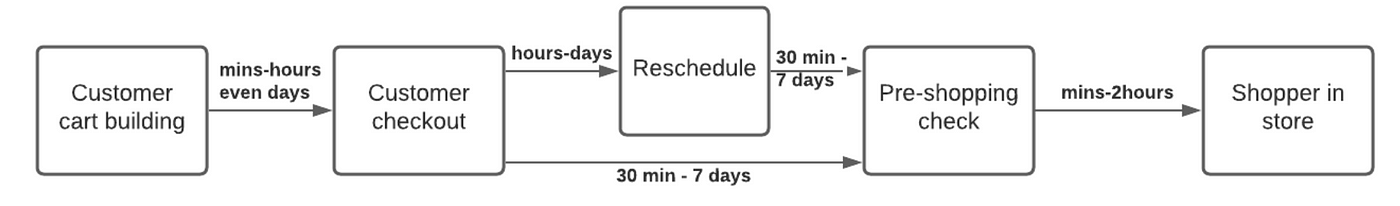
For example, increasingly, customers like to plan ahead. A customer wants to place an order at night for early next day delivery, when some items may run out at the ordering time but will restock the next day at store opening time. In the previous pipeline, because there was only one version of scores, the customer will see the item as out-of-stock (“OOS”) at order time and likely will not be able to buy it, even though the delivery won’t happen soon because they’ve scheduled it for the following morning.
As a comparison, routing of our shoppers to stores should always use the most recent signals, to identify the store with the most available items as of now. Our new pipeline therefore should be context aware, and support multiple versions of scores to power different use case scenarios, e.g., scheduled later delivery for ordering vs. sending shoppers to stores.
Legacy Infrastructure
The last problem arises from the legacy engineering infrastructure capability and costs, leading to score staleness. Because of the rapid growth of our catalog, it is not economically feasible and necessary to score very often for hundreds of millions of items. What’s more, there was several hours of delay in the signals from the source to the model serving. Therefore we need to completely rebuild the pipeline using the latest technical stack aimed for productive MLOps called Griffin developed by the Instacart Machine Learning Infra team, to reduce the costs while improving the quality and freshness of our scores.
Our new model structure mainly addresses the first and second challenges, while our new infrastructure and pipeline tackles the last two challenges.
New Model
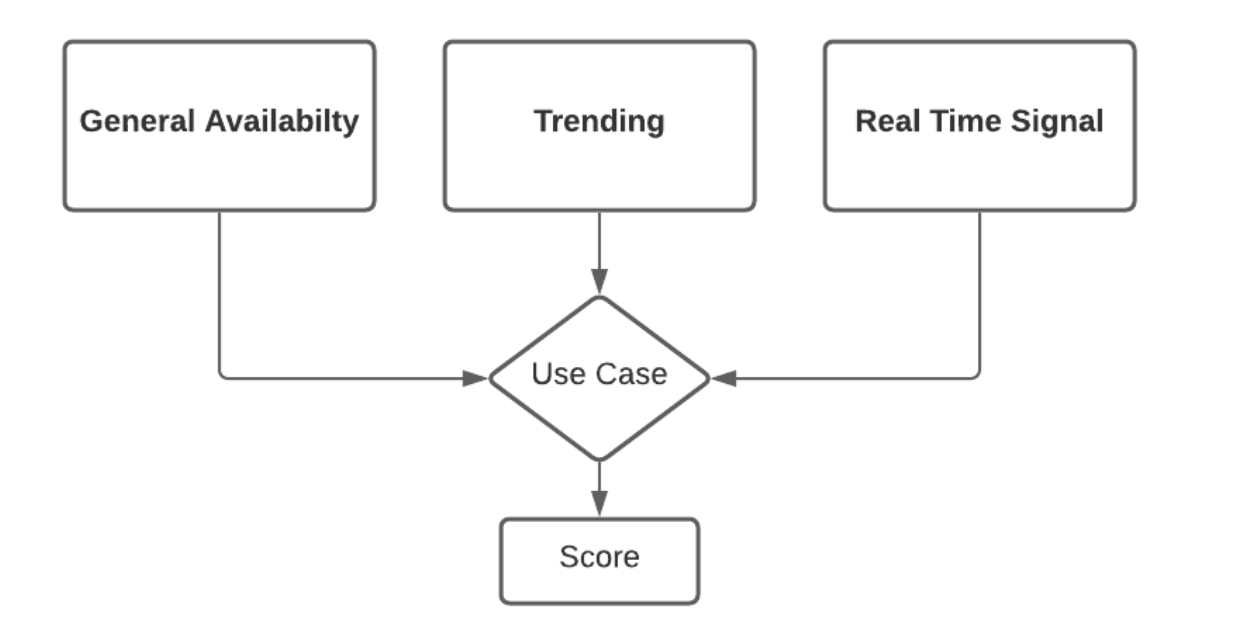
To address the challenges around interpretability and data sparsity, we came up with a new hierarchical model structure with three distinct components, short for G-T-R, and is illustrated in Fig 4. Each component plays an important and yet different role in the item availability predictions.
- G stands for General availability, which represents typical item availability patterns. It addresses the long-term pattern of availability for an item over 7–180 days and helps solve the data sparsity challenge.
- T as in Trending quantifies the deviations from the general baseline. It answers the question of “what is the observed availability over the past 0.5–30 days?”
- R stands for Real-Time, and responds to the very latest observation, which is more relevant to the likely short-term availability status than previous ones: what is the most recent pattern of shopper data and retailer inventory data today?
General scores — describing the typical patterns
General availability addresses a simple question: what is the typical probability of finding an item? In order to answer this question with a high level of confidence, we need a sufficiently large sample of observations. After finding the relevant sample, we will be able to draw a relatively reliable conclusion even with simple statistics like found rates. How can we find such a sample, given a lot of items in our catalog have a limited number of observations?
We employed an algorithm to identify the “most relevant sample of data”, by searching from the most local and recent data, aggregated from the same product and similar items purchase history in an area over a period of time, illustrated in Fig 5. The intuition is that, the more local and more recent a data point is, the more relevant it is for the scoring purpose. By imposing a required sample size K, determined by offline empirical evaluations, we are able to identify the minimally sufficient scope and confidently answer the “typical” availability question.
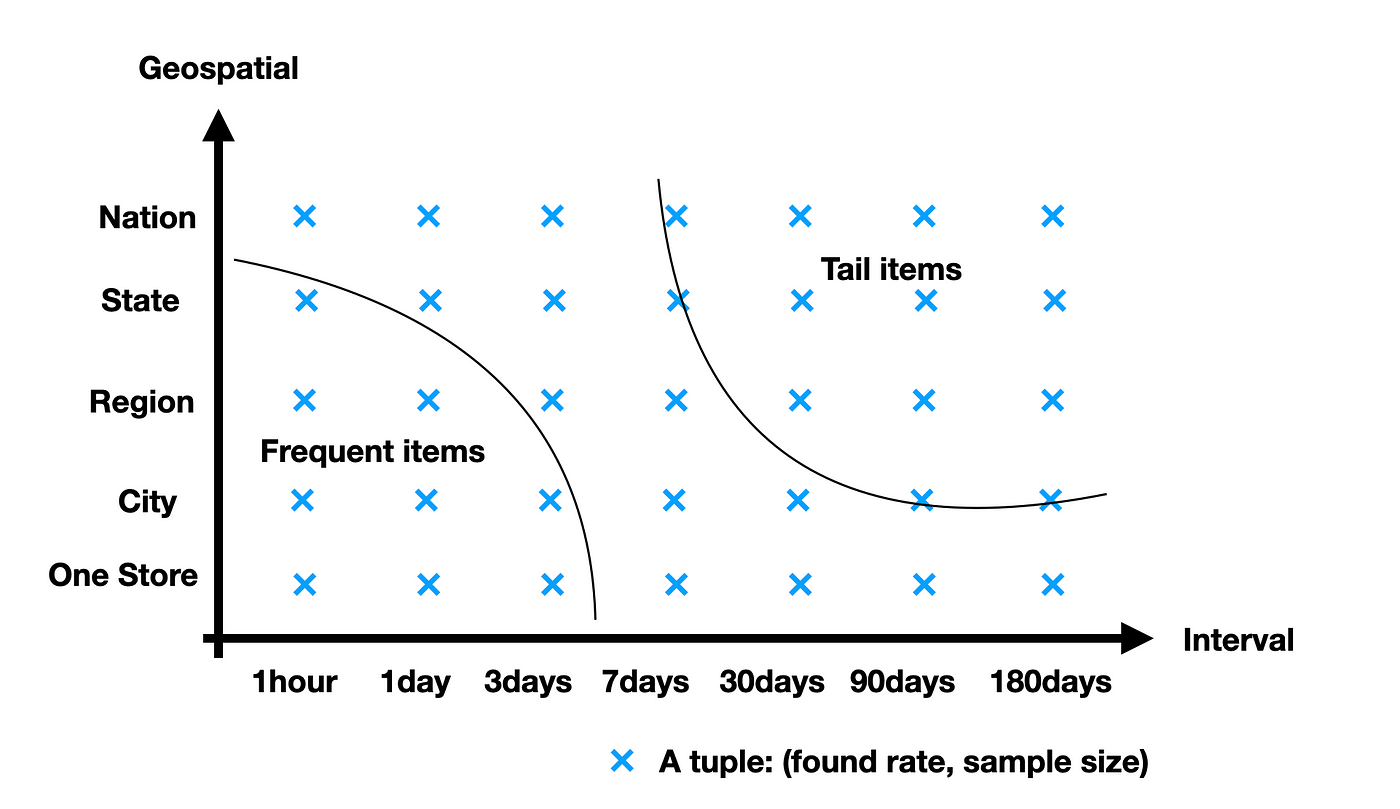
For example, we have observed more than K (sample size) shopper events for a frequent item like organic banana from one store over the last 7 days, so the found rate from one store over the last 7 days can serve as the general score. However, a rarely purchased product (tail item) may have only K sales over the last 180 days nationwide, then we need to generate a data sample from the past 180 days nationwide stores to infer the general score for this product.
Trending — quantifying deviations from the typical patterns
Since the COVID pandemic began, supply chain disruption has been commonplace. Some examples include the paper towel demand surge, baby formula shortage, water shortages due to a snow storm or a hurricane, and special events like sports championship games. The so-called “trending” model is intended to detect and quantify such near-term deviations from the long-term patterns.
Similar to our previous model, an XGBoost model is trained to quantify how much deviations from the baseline we should expect due to a recent event, either trending up, down, or holding steady, and outputs the final predictions. But different from our previous model, we consolidated multiple long-term features into the general scores as part of the input, so that the new model can have have a reliable prior with fewer features. This approach has achieved superior offline and online performance, likely due to the more stable prior of the general score. By comparing the trending output against the general part which has the highest weight among all features in the trained trending model, we can also understand how some recent events affect the item availability predictions, thereby providing interpretability.
Real time — inferring from the last known status
Real-time inference is based on the latest observation of an item status, and is able to respond to recent signals in a more timely manner, thanks to the real-time streaming infrastructure. The assumption is that the most recent observation has a higher impact on the inferred state in the short term than all previous observations.
We make an inference using real-time features generated from the last signals in addition to more historical features. The real-time features include but are not limited to: time since the last observation, last known observed status from an Instacart shopper, last status reported by a particular retailer, and retailer inventory levels. As a concrete example shown in Fig 6, once an Instacart shopper reports an item as out of stock on the shelf, we can look at historical data to understand how soon it will be back in stock (restocking to shelf time), represented as an unnormalized probability distribution function (PDF).

We can easily convert the learned PDF to a Cumulative Distribution Function (CDF), an example as shown in Fig 7, and then either use the mean/75 percentile of restocking time, area under the curve of the CDF over time, or other statistics as part of the input to the real time inference.

Another important aspect of real-time inference is that the predictive power of a single signal wanes over time. Therefore we can control the scope of real-time scored items by filtering by the last observed time, e.g., only items with last known status within 10 hours. This has been a major cost saving factor, as only about 1% of all items are eligible for real-time scoring.
The three component new model has enabled us to improve interpretability by checking the final score against each component, so that we can understand which source of features and observations contributes more to the particular prediction. It also better handles sparse data by taking sample size into consideration during the feature generation process.
New Infrastructure and Pipeline
The previous model generates features and availability probability scores for hundreds of millions of items every few hours, which has been very costly. We believe items with different purchase frequencies, i.e., head vs. torso/tail items, can benefit from different scoring schedules to reduce latency and costs. While there is no carved-in-stone definition for each group, in our empirical study, we found the following grouping working well: head (frequent) items have the latest signals within 10 hours (about 1% of all unique items scored), torso items within a month (about 85%), and the remaining items are considered tail.
The new model running schedule is shown in Fig 8 below. All items have the general and trending daily scoring, but only head items have the privilege of trending scores hourly and the real-time inference. This stratified model serving structure substantially reduces computation costs by about 80%, thanks to the less frequent scoring of torso and tail items, and has shown better metrics in the online experiment.

The real-time item availability model has been the pioneering adopter of some of the latest engineering tech stacks. It is the first use case of the real-time data streaming pipeline and the latest productive MLOps tool suite Griffin including the feature store in Instacart.
Now with an API which supports multiple versions of models, it can also support different product layers with a version specified during a query. Therefore the API can distinguish between logistics-related models and customer cart building-related models, and return different scores even for the same item but in different contexts. In this way, we can use a real time model for shopper routing, while serving our customers with a model predicting availability in a future fulfillment time.
Conclusion
While we are in a good position to better serve our customers and collaborate with our retailer partners, the road leading to the current spot has not been easy. It is a system engineering problem whose solution requires deep understanding of data, business and product processes, machine learning theories, as well as full stack, large scale systems. It requires iterative trial and error processes to align different components in order to produce optimal online performance and customer experience.
We have been able to achieve better performance during offline evaluation and online experiment while not having to make trade-offs with costs. We have been able to substantially reduce the model complexity and meaningfully decrease feature engineering time. We also saved in costs by reducing the scoring needs for torso and tail items.
The rich learnings from building the new real time model and its system have prepared us for even greater impact and value that we will bring to our customers and retailer partners in the near future.
Instacart
Instacart is the leading grocery technology company in North America, partnering with more than 1,400 national, regional, and local retail banners to deliver from more than 80,000 stores across more than 14,000 cities in North America. To read more Instacart posts, you can browse the company blog or search by keyword using the search bar at the top of the page.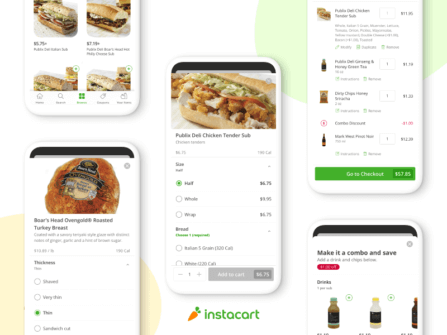 Building Instacart Meals
  7 steps to get started with large-scale labeling

Most Recent in How It's Made

How It's Made
One Model to Serve Them All: How Instacart deployed a single Deep Learning pCTR model for multiple surfaces with improved operations and performance along the way
Authors: Cheng Jia, Peng Qi, Joseph Haraldson, Adway Dhillon, Qiao Jiang, Sharath Rao Introduction Instacart Ads and Ranking Models At Instacart Ads, our focus lies in delivering the utmost relevance in advertisements to our customers, facilitating novel product discovery and enhancing…...
Dec 19, 2023
How It's Made
Monte Carlo, Puppetry and Laughter: The Unexpected Joys of Prompt Engineering
Author: Ben Bader The universe of the current Large Language Models (LLMs) engineering is electrifying, to say the least. The industry has been on fire with change since the launch of ChatGPT in November of…...
Dec 19, 2023
How It's Made
Unveiling the Core of Instacart’s Griffin 2.0: A Deep Dive into the Machine Learning Training Platform
Authors: Han Li, Sahil Khanna, Jocelyn De La Rosa, Moping Dou, Sharad Gupta, Chenyang Yu and Rajpal Paryani Background About a year ago, we introduced the first version of Griffin, Instacart’s first ML Platform, detailing its development and support for end-to-end ML in…...
Nov 22, 2023