How It's Made
How Instacart Measures the True Value of Advertising: The Methodology of Ad Incrementality
Author: Jason Kim
In today’s highly competitive digital marketplace, understanding the true value of the advertising effort is no longer a luxury but a necessity. While there are many methodologies used to evaluate the effectiveness of advertisements, Instacart has a unique advantage. We can measure ad effectiveness, often termed ad incrementality, using Randomized Control Trials (RCTs), a method widely regarded as the “gold standard.”
Instacart’s unique advantage stems from two main factors: (1) the ability to control which users see ads, and (2) availability of comprehensive sales data on our platform.
Traditional marketing channels such as billboards, posters, TV, radio, or direct mail do not have the ability to control ad visibility to facilitate randomized user experiments. On the other hand, some digital platforms, such as Google or Meta, lack the comprehensive sales data to directly measure the sales lift between control and test groups.
In this article, we will describe how we measure ads effectiveness using holdout groups, and how we apply this to randomized controlled experiments to continuously drive Instacart Ads incrementality.
Unpacking Ad Incrementality
The crux of the matter advertisers wish to understand is the effectiveness of ads or what is the benefit of spending on ads. Put simply, how much sales are “incremental” sales caused by spending on ads?
Imagine you are shopping at this exact moment, looking for lettuce to make a salad.

An Instacart ad helps the brand to surface salad tomatoes and you decide this will be a great addition to your salad, and buy the tomatoes. This is an example of an effective ad, from both an advertiser and consumer perspective.
An effective ad inspires customers, enriches the shopping experience, and presents opportunities for brands to make sales that wouldn’t have occurred without the ad’s presence. This influence on customer behavior is what we refer to as incremental sales, and our ability to measure this accurately is crucial for optimizing ad effectiveness or incrementality.
Measuring Ad Incrementality at Instacart
At Instacart, ads incrementality is measured at three different levels of granularity on an ongoing basis: advertiser, system, and experiment variant level. Currently, continual ads incrementality measurement is limited to Instacart’s Sponsored Products offering. The advertiser-level measurement is the fundamental building block for measuring ads incrementality at other levels. Therefore, we will begin by describing the measurement framework from the perspective of a single advertiser.
Advertiser-Level Measurement
In order to measure ads incrementality for a single advertiser, users are randomly split into an “ads” group, where users see ads from the target advertiser, and “holdout” group, where users will not see ads from the target advertiser. The experience that users in the holdout group would go through is as if the advertiser stopped spending entirely. Not only would they not see the ads from the target advertiser, but they would also be able to see the ads from the competitors.
The actual random assignment is executed by Instacart’s internal experiment assignment engine called “Roulette”. Users are randomized based on hash of (user_id, advertiser_id), ensuring that:
- Populations of users assigned into “ads” or “holdout” groups are identical prior to the start of the experiment. This ensures that the only variable differentiating the cohorts is the presence or absence of the tested stimulus (ad exposure). Therefore, any observable difference in the outcome metric can be confidently attributed to the effects of the stimulus.
- Each advertiser holdout is orthogonal, or independent, to each other. This orthogonality ensures that the holdouts of different advertisers do not influence each other, providing every user an equal opportunity to be part of the holdout group across different advertisers. Consequently, this arrangement implies that the holdout group from one advertiser will exert an equivalent influence on the “ad” and “holdout” groups of another advertiser, effectively neutralizing any potential bias.
Using these randomly constructed “ad” and “holdout” groups, we can measure the difference in total (organic + attributed) sales for the advertised products. This comparison allows us to measure the difference in sales that would not have occurred in the absence of ad spend, and estimate incrementality metrics such as total incremental sales, incremental sales lift percentage, and incremental sales on ad spend (incremental sales / ad spend).

Experiment Population and Ad Filtering
The ideal population that should be assigned into either “ads” or the holdout group is all users who would see ads from the target advertiser. Including users who would not have seen ads in the experiment introduces “dilution”, as these users cannot possibly contribute to incremental sales due to absence of the stimulus, and add noise to our measurement.
To achieve this ideal cohort, we must first identify all the users that are about to see an ad from the target advertiser, ensuring that all users are captured. Then, some are randomly assigned into a “holdout” group, where target ads are filtered. However, this approach introduces issues related to Instacart’s second-price auction system, including the opportunity cost of underused ad slots, the need for pricing adjustment, and the requirement to redesign result pages for the holdout ad slot.
To overcome these challenges, the holdout assignment (determining which users will be assigned into “ad” or “holdout” groups), and the ads filtering for the holdout group needs to happen before determining which ads wins the auction.
With that, we will still need to decide where to put the evaluation and filtration in the auction flow.
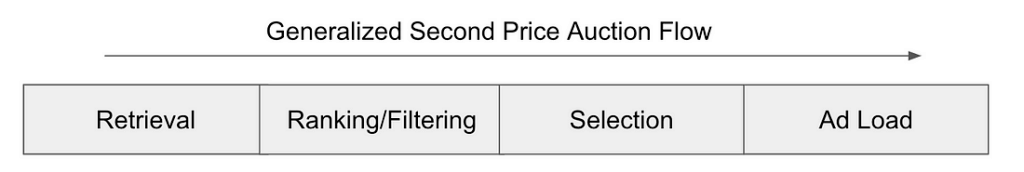
The above diagram is an (overly) simplified Second Price Auction flow for Instacart Sponsored Product ads. The number of eligible impressions will decrease after each step before the selection step, which implies that placing evaluation and filtration upstream in the auction flow causes higher dilution compared to downstream placement.
Based on these constraints, the variant assignment and filtration happens before the selection step to avoid complications with ad load and pricing, and after the filtration step to minimize the dilution factor.

However, not all “holdout” impressions make it past the selection step, creating some dilution. This issue is mitigated through “Ghost Ad” simulation.
Ghost Ad Simulation
The Ghost Ad, technique popularized by Google (Johnson, Lewis, & Nubbemeyer, 2016), further improves the dilution issue by simulating which holdout impression would have won the auction.
For the purpose of illustration, below is an hypothetical auction where five ads were requested to be served.
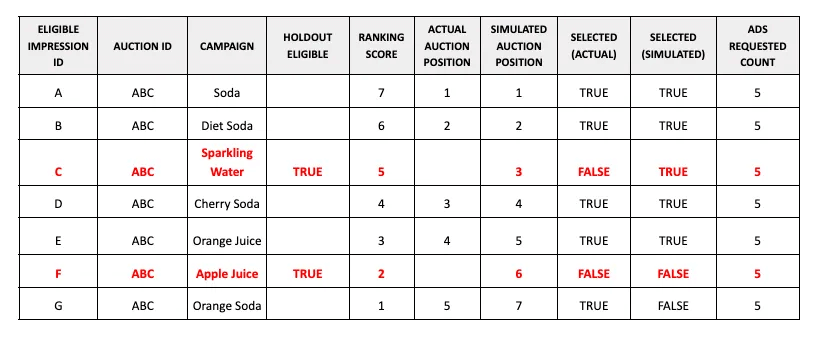
In an actual auction, “sparkling water” and “Apple juice” would have not participated because they were filtered out due to the holdout filtration. In a simulated auction where “Sparkling water” and “Apple juice” would have participated, “Sparkling water” would have been selected, but “Apple juice” would not due to the rank threshold. “Orange soda” would not have been selected for the same reason in the simulated auction, although it would have won the actual auction.
The Ghost Ad Simulation improves the precision of incrementality estimates by enabling us to run a triggered the experiment – only comparing the subset of assigned users who were exposed to ads in the ad group versus those who would have been exposed holdout users based on simulated auction outcome.
System-Level Measurement
The advertiser-level estimates are instrumental for measuring the incrementality of individual advertisers. Furthermore, we also want to aggregate the advertiser-level effects into a single metric that represents the overall ads incrementality of the Instacart platform. Such a system-level metric enables us to promptly understand performance of the platform, and track its evolution over time.
System-level aggregation is accomplished by calculating “weighted” averages across all advertisers. This method is more sensible than simple average, or median, which do not account for the varying scale of the advertisers. Larger advertisers contribute a more significant portion of the overall ad spend on Instacart compared to smaller, long-tail advertisers.
The choice of weights depends on the specific incrementality metric under consideration. For instance, when calculating the incremental return on ad spend (iROAS), the system-level iROAS is determined as the weighted average iROAS across the advertisers. Here, the weights correspond to each advertiser’s ad spend.
Experiment Variant Measurement
Now that we can measure the ads incrementality on a system level, we may want to optimize it. This is accomplished by calculating incrementality metrics same as the system-level metrics, for each variant in the experiment.
As the advertiser-level holdout is active at any given time, we can run a product experiment in a traditional A/B test framework that is orthogonal to the advertiser-level holdouts. The orthogonality ensures that a random subset of users in the product experiment will be in the holdout group for each advertiser. This set-up allows us to measure the difference in overall incrementality by comparing the difference in system-level incrementality metric between each of the variants.

Conclusion
Ensuring effective results and value for advertisers is a top priority for the Instacart Ads team. This measurement framework is simply the foundation of our approach. We’re always to make improvements that increase value for our advertisers in innovative and meaningful ways in the ever-changing landscape of digital advertising.
Instacart
Instacart is the leading grocery technology company in North America, partnering with more than 1,400 national, regional, and local retail banners to deliver from more than 80,000 stores across more than 14,000 cities in North America. To read more Instacart posts, you can browse the company blog or search by keyword using the search bar at the top of the page. Building Instacart Meals
  7 steps to get started with large-scale labeling

Most Recent in How It's Made

How It's Made
One Model to Serve Them All: How Instacart deployed a single Deep Learning pCTR model for multiple surfaces with improved operations and performance along the way
Authors: Cheng Jia, Peng Qi, Joseph Haraldson, Adway Dhillon, Qiao Jiang, Sharath Rao Introduction Instacart Ads and Ranking Models At Instacart Ads, our focus lies in delivering the utmost relevance in advertisements to our customers, facilitating novel product discovery and enhancing…...
Dec 19, 2023
How It's Made
Monte Carlo, Puppetry and Laughter: The Unexpected Joys of Prompt Engineering
Author: Ben Bader The universe of the current Large Language Models (LLMs) engineering is electrifying, to say the least. The industry has been on fire with change since the launch of ChatGPT in November of…...
Dec 19, 2023
How It's Made
Unveiling the Core of Instacart’s Griffin 2.0: A Deep Dive into the Machine Learning Training Platform
Authors: Han Li, Sahil Khanna, Jocelyn De La Rosa, Moping Dou, Sharad Gupta, Chenyang Yu and Rajpal Paryani Background About a year ago, we introduced the first version of Griffin, Instacart’s first ML Platform, detailing its development and support for end-to-end ML in…...
Nov 22, 2023