How It's Made
Building for Balance
How we developed a unified marketplace balancing engine with machine learning and optimization. Written by Trace Levinson, Senior Machine Learning Engineer.
The Instacart Marketplace team is deeply focused on producing both timely, high-quality deliveries for our customers and meaningful earning opportunities for shoppers. To consistently do both of these well, it is critical for us to maintain a healthy balance between supply and demand on the platform. Even slight misalignment can erode trust with one or both of these groups.
So, how do we achieve marketplace balance? The task can be framed by two broad subtasks: (1) forecasting upcoming marketplace health; and (2) decisioning on the appropriate levers to improve it where necessary.
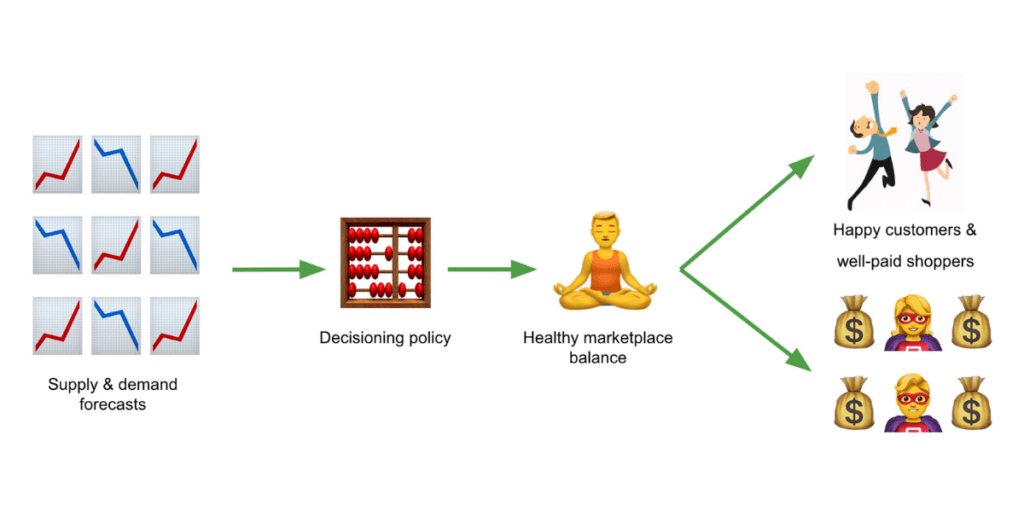
We’ll dive primarily into the evolution of our decisioning solution in this post, with a brief overview first of our forecasting approach.
Forecasting supply-demand imbalance
Performant forecasts of upcoming supply and demand are crucial components of an effective balancing ecosystem. After all, decisioning systems cannot be impactful without first identifying the right problems to solve. At a high level, our forecasting system is designed to target a specified threshold of key marketplace metrics at any given time.
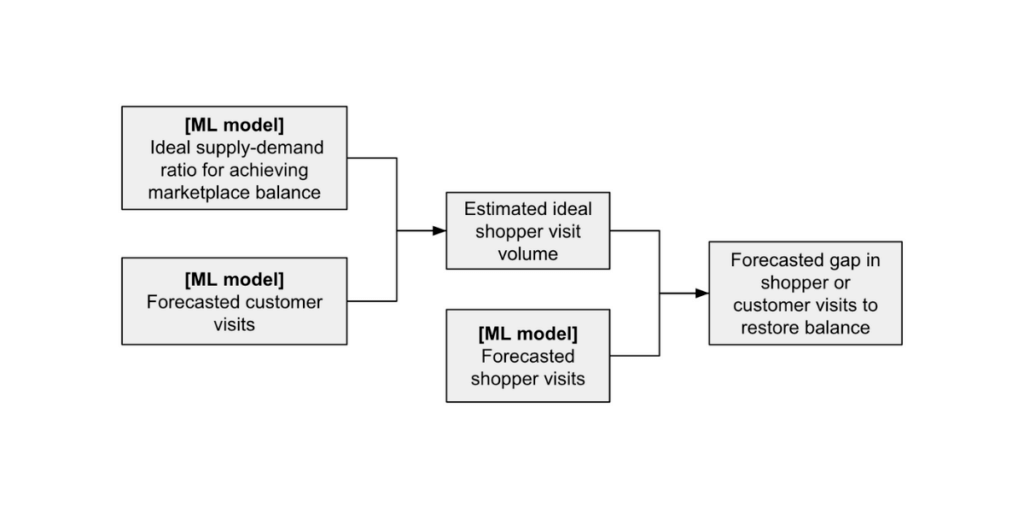
First, forecasts for supply (how many shoppers we expect to appear organically on the platform) and demand (expected customer visits) are generated for many upcoming time horizons. These relative supply and demand forecasts then map to the marketplace outcomes we are most likely to observe as a result. If those outcomes vary from our desired state, we can quantify this misalignment and translate it into a number of incremental shoppers or customers we should aim to guide onto the platform to restore balance.
Solving the imbalances: conceptualizing the balancing engine
Once we are confident in the amount of supply or demand needed to restore balance, how do we achieve these goals? There are several broad categories of interventions we can take. A few of these include:
- Onboarding additional shoppers
- Providing incentives to existing shoppers (including those who engaged in the past but have churned)
- Incentivizing customers to place orders at specific times
We had originally triggered each lever above independently. After recognizing inefficiencies stemming from this lack of coordination, we began ideating toward a global allocation engine: a single system to evaluate all possible interventions on level ground and determine the optimal lever mix to solve a joint objective.
Developing the initial engine
The first iteration of our solution was built and launched in 2020, coined the SAGE (Supply Allocation & Generation Engine) system. When architecting a large new system, it is important to stay focused on its core objectives and design accordingly. We honed in on the following objectives for SAGE:
- Maximize incremental deliveries fulfilled wherever we project demand to outweigh supply
- Minimize oversupply observed on the platform wherever we project supply to outweigh demand
- Remain within clear ROI thresholds established from our operations partners to ensure cost effectiveness of our actions
System inputs
Formulating inputs for this type of unified system comes with technical challenges. Perhaps most notable is the set of varying timelines within which different input levers take hold in the marketplace. Activating new shoppers, for example, involves a series of steps as shoppers move through the onboarding funnel. This causes a lag between the period when a shopper first signs up and when they are eligible to begin working. Incentives, by contrast, can mobilize existing shoppers with as little as an hour of lead time.
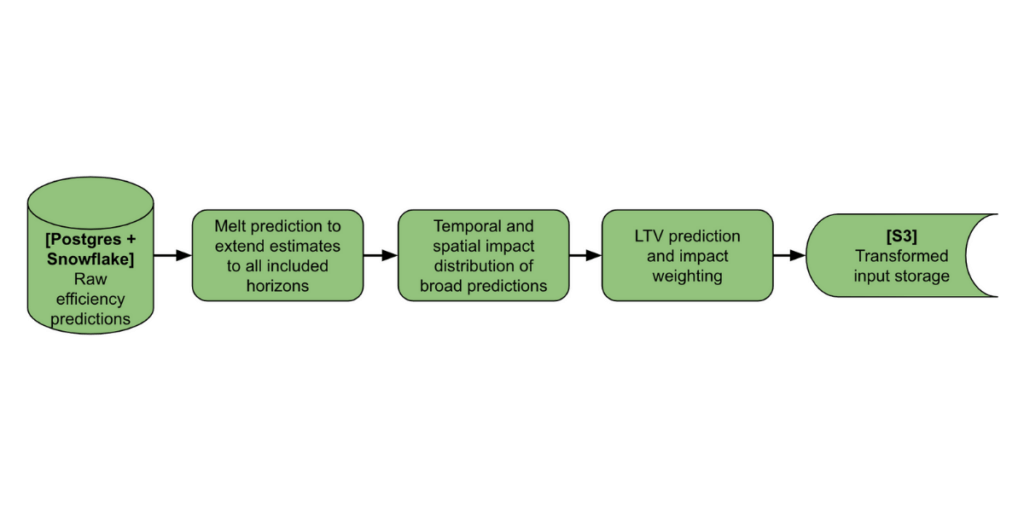
In order to make apples-to-apples tradeoffs, a combination of heuristic and machine learning-driven transformations are made on top of our raw estimates to standardize all levers across the following dimensions:
- Short-term impact: incrementality predicted to occur during the intervention period
- Long-term impact: additional incrementality predicted to come after the intervention period
- Spatiotemporal impact distribution: predicted distribution of total incrementality across hours of day, days of week, and smaller geos within and beyond the broader intervention region
At the time of v1 system development, we had not yet invested in frameworks to produce reliable nonlinear efficiency curves. This iteration was therefore restricted to heuristic inputs with simplifying assumptions of constant efficiency across all spend levels.
V1 optimization framing and results
These inputs were then fed together with supply-demand imbalance (aka “supply gap”) forecasts into a linear program pooled over all geographies. The optimization objective seeked to maximize total incremental deliveries fulfilled during a one-week forecast period.
Despite simplifications made in this initial version, SAGE v1 produced substantial improvements. We were able to improve spend efficiency and dramatically reduce overhead for our operations partners managing the budgeting process.
When to upgrade? Making the case for SAGE v2
It can often be challenging to decide how much time a team should iterate lightly on an existing production system before investing in a larger overhaul. To build intuition here over time, we systematically observed SAGE’s strengths and shortcomings under different scenarios. We also established areas of improvement that we knew would require changes to other input systems beforehand.
After about a year with the v1 system in production, a number of structural changes had occurred in our surrounding balancing ecosystem:
- We had invested in much more granular targeting for a number of individual levers. For example, several of our incentive systems had migrated onto uplift models, a valuable machine learning framework for estimating heterogeneous treatment effects. These systems now unlocked the production of precise marginal efficiency curves in place of heuristic estimates.
- Our team had grown substantially in size and expertise, creating bandwidth to explore more sophisticated system architectures.
- The macro-environment had posed a number of broad marketplace balancing challenges for Instacart. This left us collectively hungry for more responsive systems to prepare for potential events like worker shortages in the future.
Through initial discussions, the above factors quickly became compelling for investment in the next iteration. We decided to fundamentally revisit the structure of our balancing engine and develop a new system with several key differences.
V2 system improvements
Joint decision making over a multi-week forecasting horizon
Rather than targeting a single upcoming week for forecasting and decisioning, the v2 system now jointly optimizes over several upcoming weeks. This provides a number of benefits, most notably:
- Improving visibility into upcoming marketplace movements: It was important to build SAGE v2 such that we enable more forward-looking response strategies to our dynamic macro-environment.
- More optimally distributing lever scale capacity over upcoming weeks: Our balancing levers are often constrained by a finite audience that can be targeted at most once over several weeks or months. V2 smoothes these deployments more effectively across time.
- By comparison, v1 inherently solved for a local optimum by decisioning on only a single upcoming horizon. This could often result in all-or-nothing deployment scale recommendations.
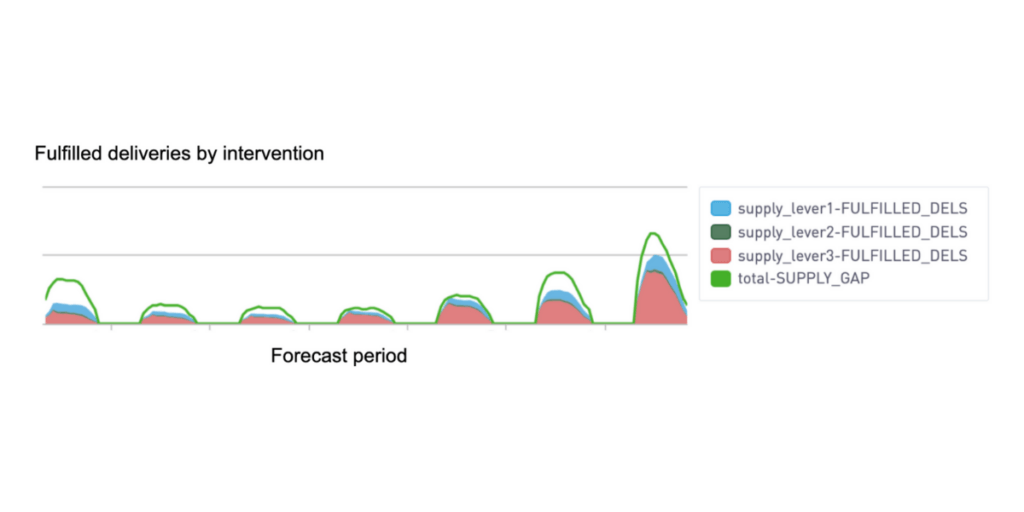
By simulating outcomes from each combined action and impact period, the system provides insight into how gap fulfillment is predicted to layer up across upcoming weeks (horizons 1-6 below). The operations team can then compare these predicted outcomes across various simulations to better inform any setting adjustments needed.

More flexible optimization to account for nonlinearity
As referenced earlier, the v1 system carried the strong assumption of constant efficiency across all spend levels. In v2, we wanted SAGE to capitalize on our recently developed nonlinear efficiency capabilities within surrounding systems. There are a number of existing nonlinear optimization techniques and open-source libraries to accomplish this. However, scipy.optimize and other QP solvers tend to struggle with complex, non-quadratic functional forms. For SAGE, we would need to maintain flexibility to feed in efficiency curves from model and functional structures that were unique to each balancing lever. After also considering more adaptable solvers such as mystic, our requirements of flexibility, consistency, and low latency ultimately led us back to an adapted mixed integer programming (MIP) approach using the python-mip package.*
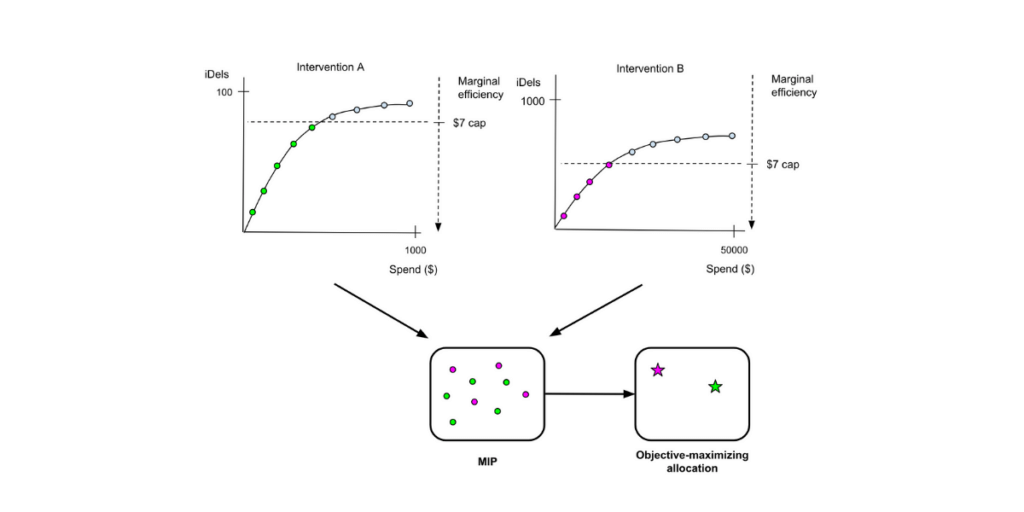
Through offline testing, we discovered that each input efficiency curve could be discretized into a large number of points along the curve while maintaining high precision. Rather than setting decision variables up as continuous budgets per intervention, the MIP is then reformulated as a binary assignment problem. Each curve point is treated as a solution candidate, yielding an optimal value of 0 or 1 reflecting whether it is recommended as the production budget. Optimization constraints are set up to enforce that only one point on each curve is chosen. Prior to solve phase, any curve points in violation of our efficiency constraints are also pruned to reduce candidate set cardinality and improve latency. This process is illustrated below.
* This came after an attempt to first productionize with pulp. We encountered edge-case bugs with this library and found python-mip to be more robust when formulating complex MIPs.
System re-architecture to parallelize across regions
The final impactful change we made was an architecture overhaul from a single global optimization to a parallelized region-level optimization structure. There was notable uncertainty here when trading off between development time and eventual impact of this change. On one hand, parallelization required multiple new AWS services and migration onto a Celery cluster for job orchestration. However, a number of benefits ultimately persuaded us to invest here:
- More optimal geo-level solutions: System noise is induced by pooling all markets within a single formulation, with each region’s allocation decisions directly influenced by those of others. Independent optimizations provide tighter control over each market’s outcomes.
- Significant latency gains: A single v1 run could often take over an hour. Without parallelization, latency may have become an increasingly large bottleneck under the more complex v2 MIP formulation. We also established stricter latency SLAs for v2 given deeper simulation capabilities built into the new system; fast runtime was now required for quick simulation turnaround. The parallelized architecture facilitates this by dramatically reducing solve time.
- Robust A/B experimentation: Previously, spillover effects between treatment and control regions were unavoidable in a global optimization. These issues are now mitigated when running region-level A/B tests on future system changes.
Resulting v2 formulation
Within this new structure, each region solves a MIP formulated similar to the following:
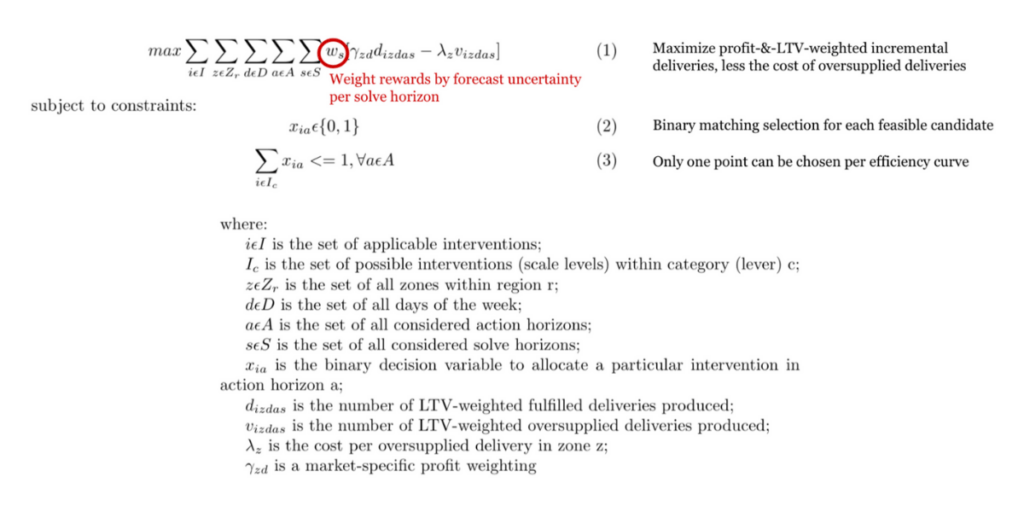
Additional constraints are added from here to control the solution within efficiency and budget guardrails.
V2 system results
The migration onto v2 produced very fruitful results. By better targeting supply spend toward markets of greatest need, we were able to meaningfully reduce customer lost demand (estimated loss due to a lack of supply-dependent available delivery slots). This improvement could now be estimated within simulations and measured against actual outcomes.

At the same time, scaling back interventions in healthy markets increased shoppers’ access to work and utilization. Finally, our overall system efficiency improved with a notable reduction in aggregate spend levels.
Acknowledgements
This project has come to life with deep partnerships across our engineering, product, data science, and operations teams. Special thanks go out to Rockson Chang, Zhaoyu Kou, Henry Pan, Jianhui Tian, and Soren Zeliger for their engineering contributions. Additional thanks to Ji Chen, Mike Freimer, and Aman Jain for project guidance and draft reviews on this post.
We’re hiring!
We are just getting started here. Tons of challenges remain as we continue to optimize across real-time positioning, dynamic pricing, incentives, and other integrated systems. If this type of work at the unique cross section of economics, machine learning, and operations research piques your interest, come and join us! We’re always looking for motivated people to help transform our marketplace ecosystem and generate massive impact.
Instacart
Author
Instacart is the leading grocery technology company in North America, partnering with more than 1,400 national, regional, and local retail banners to deliver from more than 80,000 stores across more than 14,000 cities in North America. To read more Instacart posts, you can browse the company blog or search by keyword using the search bar at the top of the page. “Avacado” or Avocado?
  7 steps to get started with large-scale labeling
  Bringing Instacart Pickup to life
  Building an on-demand fulfillment engine is hard

Most Recent in How It's Made
How It's Made
One Model to Serve Them All: How Instacart deployed a single Deep Learning pCTR model for multiple surfaces with improved operations and performance along the way
Authors: Cheng Jia, Peng Qi, Joseph Haraldson, Adway Dhillon, Qiao Jiang, Sharath Rao Introduction Instacart Ads and Ranking Models At Instacart Ads, our focus lies in delivering the utmost relevance in advertisements to our customers, facilitating novel product discovery and enhancing…...
Dec 19, 2023
How It's Made
Monte Carlo, Puppetry and Laughter: The Unexpected Joys of Prompt Engineering
Author: Ben Bader The universe of the current Large Language Models (LLMs) engineering is electrifying, to say the least. The industry has been on fire with change since the launch of ChatGPT in November of…...
Dec 19, 2023
How It's Made
Unveiling the Core of Instacart’s Griffin 2.0: A Deep Dive into the Machine Learning Training Platform
Authors: Han Li, Sahil Khanna, Jocelyn De La Rosa, Moping Dou, Sharad Gupta, Chenyang Yu and Rajpal Paryani Background About a year ago, we introduced the first version of Griffin, Instacart’s first ML Platform, detailing its development and support for end-to-end ML in…...
Nov 22, 2023