Instacart Ads
Our Fluffy Friends — Pet Care Trends on the Instacart Marketplace

As the leading online grocery platform in North America, Instacart is able to offer brands aggregated, anonymized consumer insights about online shopping patterns across the U.S. and Canada.
This data includes insight into what consumers are buying, how they’re finding what they buy, what items are commonly found together in baskets, and trends over time as consumer shopping habits and trends evolve. By analyzing this data we can uncover interesting consumer trends and insights, which we’ll periodically share in our Consumer Insights series.
In advance of International Dog Day, we’re shining the spotlight on our fluffy friends. In this article, we look at ecommerce trends within the pet care category.
We’re caring for more pets
Those who’ve grown up with a fluffy friend or two know an animal companion around the house can make the difference between a good and a great day. Dogs give their owners a reason to get out of the house and go for a walk, and cats can be excellent cuddlers.
Studies confirm what pet owners have felt all along — that pet ownership can be just as beneficial to the owner. A recent article in The Guardian entitled “‘Dogs have a magic effect’: how pets can improve our mental health” notes that “canine companions trigger similar neural pathways to the parent-baby bond, and reduce loneliness and depression.”
So it’s not all that surprising that during the pandemic people looked for additional emotional support, increasing pet ownership.
This study conducted in December 2020 found 10% of survey respondents reported acquiring a new pet, up from 6% in June 2020. In addition, the American Pet Products Association (APPA) recently released results of its 2021 survey on national pet owners. As reported, 14% of respondents obtained a new pet during the pandemic. And the pandemic influenced the decision of one in four new pet owners to obtain their new pet.
Pet care shopping moves online
But it’s not just a rise in pet ownership that led to more ecommerce sales within the pet care category. As food shopping moved increasingly online, pet care shopping did too. The APPA also reports —
“Pet owners shopping online increased by almost 20%, from 72% in the prior year to 86% of responses in this year’s study. Before the pandemic, 60% of pet owners usually purchased pet products in person at brick-and-mortar stores. During the pandemic, in-person shopping dropped to 41%, aligning more closely with the 46% of pet owners who prefer to purchase online with purchases shipped to their home.”
Pet care trends on the Instacart marketplace
Our data concurs. Looking back to pre-pandemic levels in late 2019 we can see that the stabilized levels of pet food sales is now 3x higher. If we graph weekly sales and look at the relative levels, we can see a few patterns:
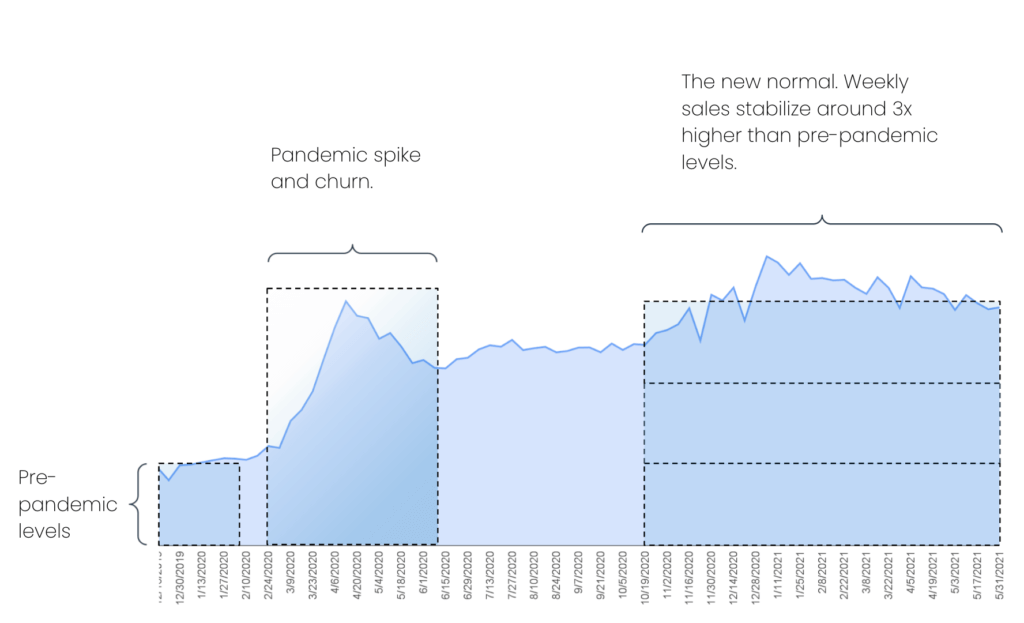
Weekly pet food sales on the Instacart marketplaceAfter the initial spike and churn from the pandemic, a new normal was established on the Instacart marketplace and weekly sales remained at a sustained high compared to pre-pandemic levels.
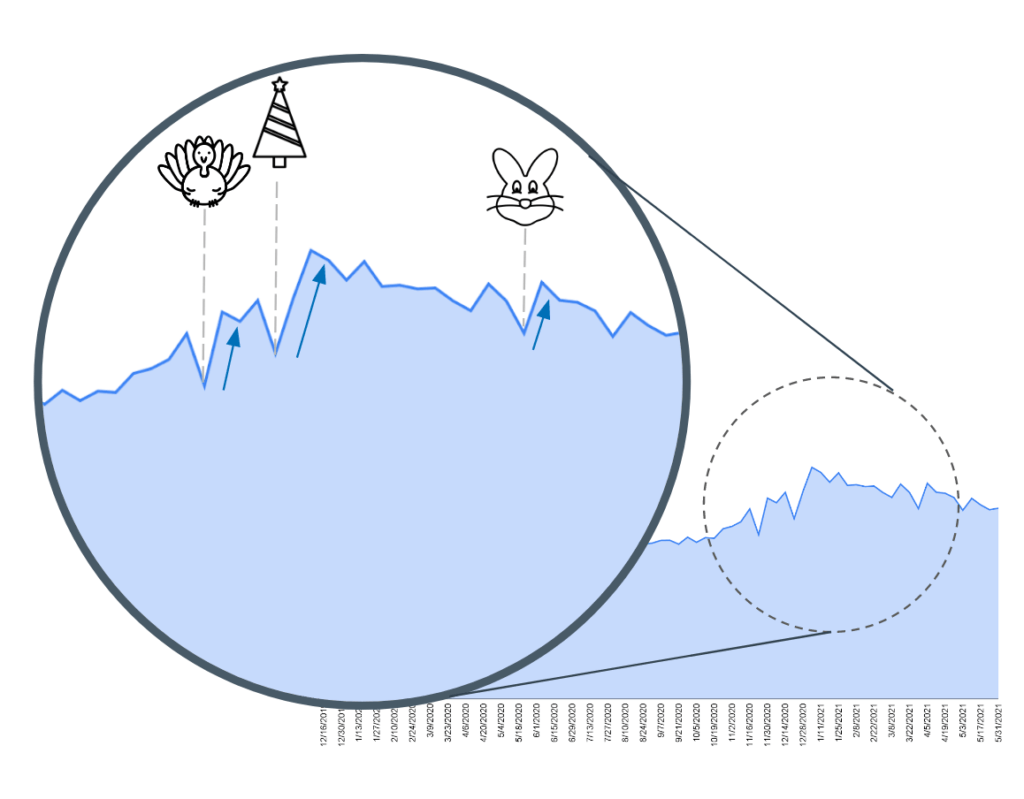
We can also see a pattern around holidays with pet care sales dropping the week of the holiday and then spiking after—
Pet care basket affinities
This new normal is good news for pet care brands who want to reach consumers on the Instacart marketplace. But what broader implications does heightened pet ownership and pet care sales have for online grocery shopping? To understand whether products beyond the pet care aisle were impacted, we took a look at some pet care basket affinities.
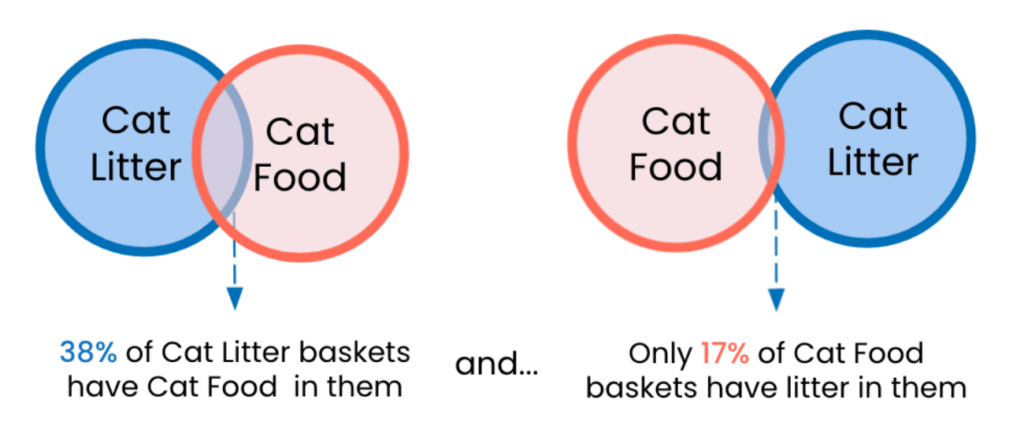
A basket affinity describes how likely products (or brands, categories, or sub-categories) are to be bought together.
There are some obvious connections within pet care — like baskets that contain cat litter also contain cat food. Although more than double the percentage of baskets with cat litter have cat food than vice versa, suggesting the purchase of cat litter is a better indicator of a pet care shopping mission.
Instead of pet care focused shopping missions, we see consumers buy pet food as part of their regular grocery shop — with complete meals, soft drinks, coffee, and coffee creamer all showing up often in the same basket.

Pet food sales and pet households
With over 600+ retail partners, Instacart is available to more than 85% of US households. This means we can identify consumer trends coast-to-cast, as well as identify and highlight regional nuances that can be of interest to anyone who wants to understand how consumers shop for groceries online on say the west coast versus the midwest.
To look into the regional differences in online pet food sales, we first wanted to see what pet ownership looked like across the country. So we looked at publicly available data on the percentage of households with pets per state and the number of households per state to calculate by census region what percentage of the total number of US pet households each region represented.
At a state level, the percentage of households with pets varied from 40% at the low end (California) to 70+% (Wyoming, West Virginia, and Vermont). Grouping this to census regions, the percentages level out—
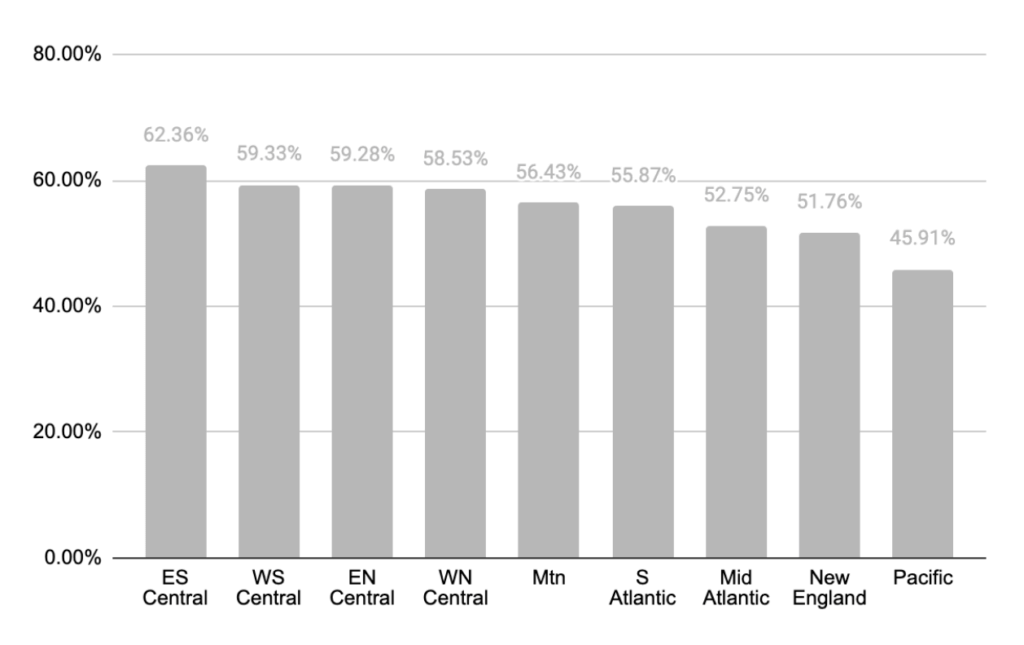
The biggest difference is between the Pacific region, at 45% of the region’s households owning pets compared to 62% in the East South Central region. But when we look at the percentage of US households in each region vs their percentage of US pet households, we see most regions contributing roughly the same proportion to each total. For example, the Mid Atlantic region has 12% of all pet households in the US and 13% of all households in the US. In fact, 7 of the 8 regions conformed to this — making up the same percentage (within one percent) of the total pet households as total households. The only outlier was the Pacific region, which has roughly 15% of all US households but only 12% of all US pet households.
Given these slight differences in proportions region to region, we would expect to see the sales of pet food on the Instacart marketplace to follow along similar lines. A region like the Pacific with 12% of the pet households in the US should command around 12% of the pet food sales on the Instacart marketplace, everything else being even.
But of course there are regional differences in consumer demographics, economic factors, spending habits, number of pets per household, and types of pet per household – a large dog breed likely costs more in pet food than, say, a hamster.
We mapped both the percentage of US pet households and percentage of pet sales on the Instacart marketplace, by region. Here’s what it looks like—
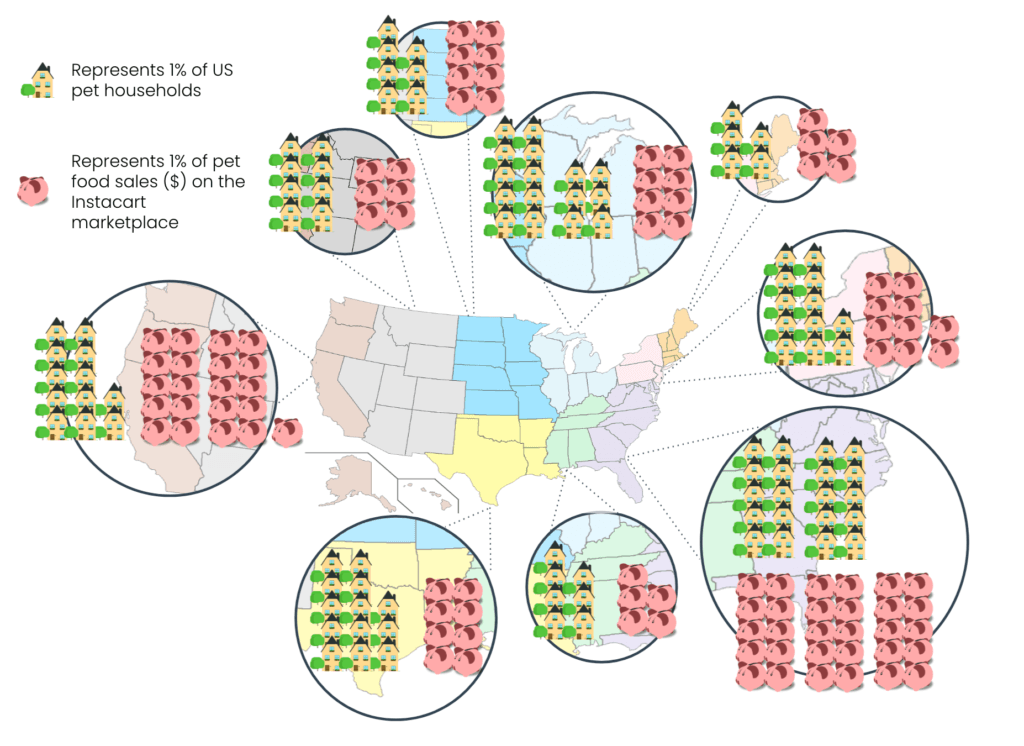
Regions like the Pacific and South Atlantic overspend, relative to their proportion of US pet households. The Pacific region accounts for 12% of pet households but approximately 21% of pet food sales on the Instacart marketplace. While the South Atlantic has 20% of the pet households and approximately 30% of pet food sales on the platform.
While East North Central underspends by the largest margin, relative to its proportion of US pet households. The region accounts for 16% of pet households but only 8% of pet food sales.
Since this looks at sales dollars, we’d expect that the price of pet food plays a factor — since in certain regions nearly everything costs more, including pet food.
But that doesn’t explain regions like New England and Mid Atlantic which both have a relatively high cost of living index, but do not overspend on pet food, relative to their proportion of pet households in the US. In fact, the Mid Atlantic region has 12% of the US pet households but only accounts for 10% of the sales.
What the data does highlight is the importance of context. Pet food brands deciding where to focus their marketing efforts might index to the cost of living, reasonably expecting that their New England and Mid Atlantic consumers to be among the most valuable. But that approach would miss out on the South Atlantic opportunity.
Similarly, looking at just the number of pet households in each region to determine priorities can be misleading. Pet households in the Pacific contribute 3.5 times more to the total pet food sales in the US than pet households in the East North Central region.
Interested in learning more insights about how your categories perform on the Instacart marketplace? Then you’ll want to partner with us.
Instacart
Instacart is the leading grocery technology company in North America, partnering with more than 1,400 national, regional, and local retail banners to deliver from more than 80,000 stores across more than 14,000 cities in North America. To read more Instacart posts, you can browse the company blog or search by keyword using the search bar at the top of the page. How Consumers Shop on Instacart – Unique Consumer Behavior
  Advertising on Instacart 101: Where Do My Ads Show?
  How Instacart Ads provides value today and in the cookieless future

Most Recent in Instacart Ads
Company Updates
New Circana Case Studies Underscore Instacart’s Incremental Sales
Instacart's consumer base is complementary to brick-and-mortar as Circana studies found that 75% and 90% of Instacart buyers for studied CPG brands only purchased the studied brands on Instacart and not in-store Over the last…...
May 2, 2024
Instacart Ads
Wildwonder: Sparkling Growth on Instacart
Wildwonder makes delicious sparkling drinks that offer a healthy alternative to soda with botanically and culturally inspired flavors like Guava Rose and Raspberry Lychee. Their drinks have bold fruit flavors and gut-supporting prebiotics and probiotics.…...
Apr 29, 2024
Instacart Ads
Fire & Smoke Society Spices Up Sales with Instacart Ads
Fire & Smoke Society, the makers of spices, rubs, seasoning, and sauces with playful names like ‘Potato Slayer’ and ‘Mayor Of Rub Town’ got their start back in 2018. Originally, the spices and seasonings were…...
Apr 17, 2024