Planning & Prep
44+ Cooking Statistics for the Foodie + Home Chef (2023)
Dating back to our earliest ancestors, cooking is something we do to nourish our bodies and gather with loved ones.
While our methods of cooking have certainly evolved from an open fire to modern gadgets like an air fryer, cooking continues to be a chance to show our love for our family and friends and flex our skills in the kitchen.
From experimenting with new types of cooking techniques to tasting new cuisines, cooking also offers a chance to expand our palate and share what we find with others.
If you’re looking to learn more about Americans’ cooking habits and pick up some fun facts along the way, take a look at the surprising cooking statistics we’ve gathered below.
Table of Contents:
- How COVID-19 changed home cooking
- General cooking facts
- Generational cooking statistics
- Cooking behaviors
- Fun facts about cooking
- Cooking statistics FAQ
How COVID-19 changed home cooking
It’s no secret that the pandemic has made an impact on how we eat. The stats below shine a light on how Americans’ cooking behaviors have shifted since the start of the COVID-19 pandemic.
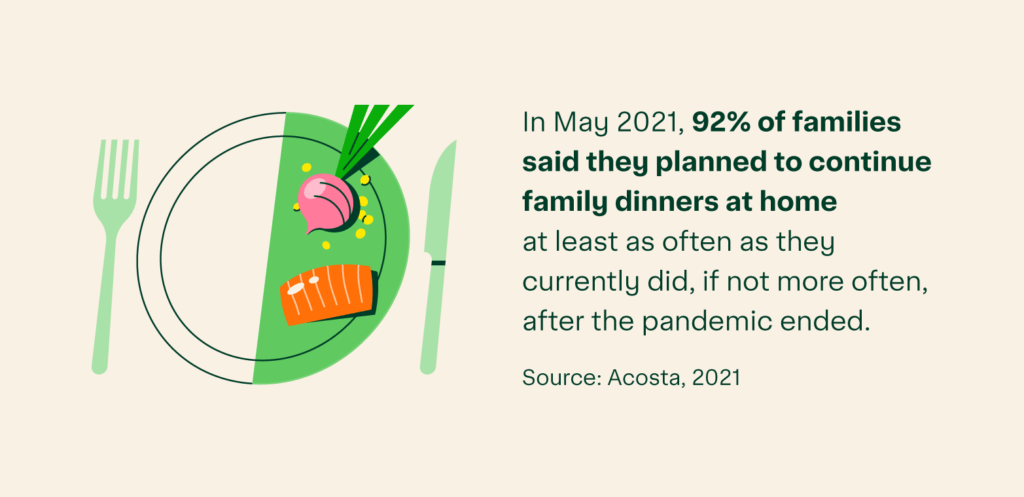
- In May 2021, 92% of families said they planned to continue family dinners at home at least as often as they currently did, if not more often, after the pandemic ended.1
- 31% of people tried new recipes during the COVID-19 pandemic.2
- 23% of people experimented with different cuisines, ingredients, or flavors since the start of the pandemic.2
- Of the 54% of people cooking more at home, 72% are preparing more pasta and rice than usual, the biggest percentage of any of the food groups.3
- As of November 2021, 44% of Americans have tried making a social media food trend.4
- 36% of Americans say social media has changed how they approach cooking at home.4
- 51% of parents reported they had more family dinners during the pandemic than before.5
- 40% of adults ate lunch at home during the pandemic, compared to 26% pre-pandemic.1
- A March 2022 survey found that 38% of all grill owners purchased a new grill in the past two years. Of those who purchased in the last year, 27% did so because “they were cooking at home more due to the pandemic.”6
- As of October 6, 2022, the average weekly household grocery spending is $148 per week. This is less than the $161 per week grocery spending at the height of the COVID-19 pandemic.7
General cooking facts
From food preparation preferences to which gender cooks the most per week, the following cooking stats shed light on America’s cooking routines.
- A microwave is the most commonly used cooking appliance.8
- Mexican cuisine is the most popular homemade cuisine in the United States, followed closely by American cuisine.9
- 73% of Americans snack at least once a day in 2022, up from 58% in 2021.10
- Sugar and sweeteners are the most common ingredients that Americans avoid.11
- Americans consumed 264 pounds of meat per person in 2020.12
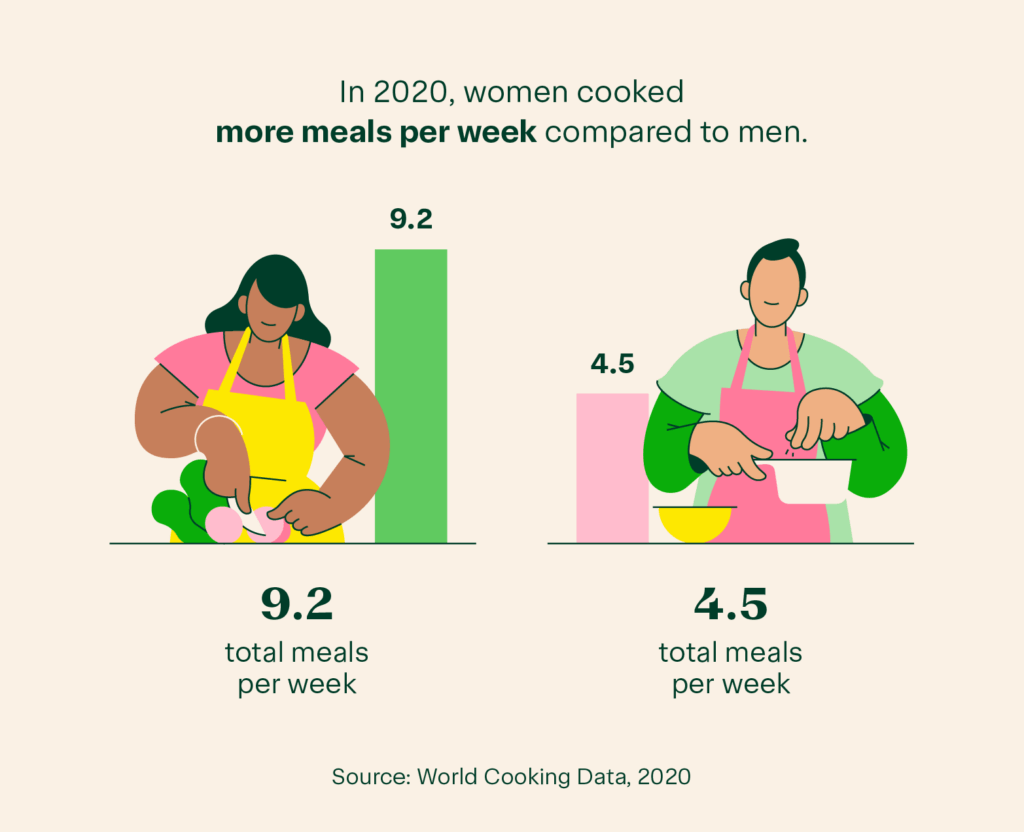
- In 2020, women cooked 9.2 total meals per week compared to men who cooked 4.5 meals per week.13
Generational cooking statistics
Below we dive into statistics around how different generations choose to cook, which just happen to make great fun facts for your next multigenerational meal.
- Millennials are 37% more likely to believe their food choices have an impact on the environment than baby boomers.10
- 57% of consumers are concerned about food waste. Baby boomers are much more likely to be concerned because of the financial impact and they were taught to not waste food, while younger generations are more likely to care because of environmental impact.10
- Baby boomers and Generation X are more likely to cite flavor and quick preparation as important criteria for home-cooked meals than other generations.11
- Generation Z is 5% more likely to prefer American food than millennials, while millennials are 7.8% more likely to prefer Mexican food than Generation Z.9
- 26% of Gen Xers say they do not eat breakfast on weekdays, compared to 25% of baby boomers, 18% of millennials and 17% of Gen Z adults.14
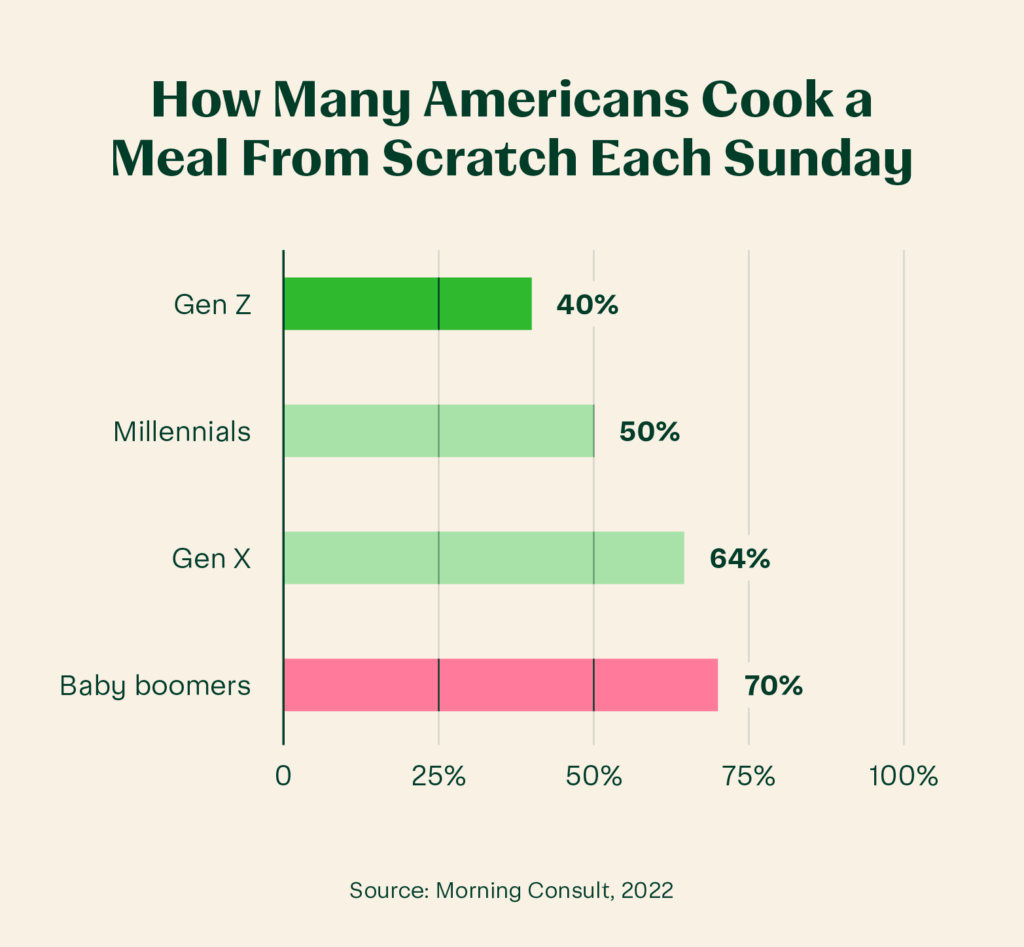
- 70% of baby boomers say they cook dinner at home from scratch every Sunday, compared to 40% of Gen Z adults.14
Cooking behaviors
Whether you prefer tasty Crockpot recipes, quick air fryer nibbles or delicious takeout, here’s a look at how Americans’ cooking habits may stack up to your own.
- 60% of women and 33% of men engage in food preparation on an average day.15
- 61% of Americans say they cook a meal at home on Mondays, compared to 49% on Fridays.14
- In 2022, 44% of Americans say they meal prep regularly.16
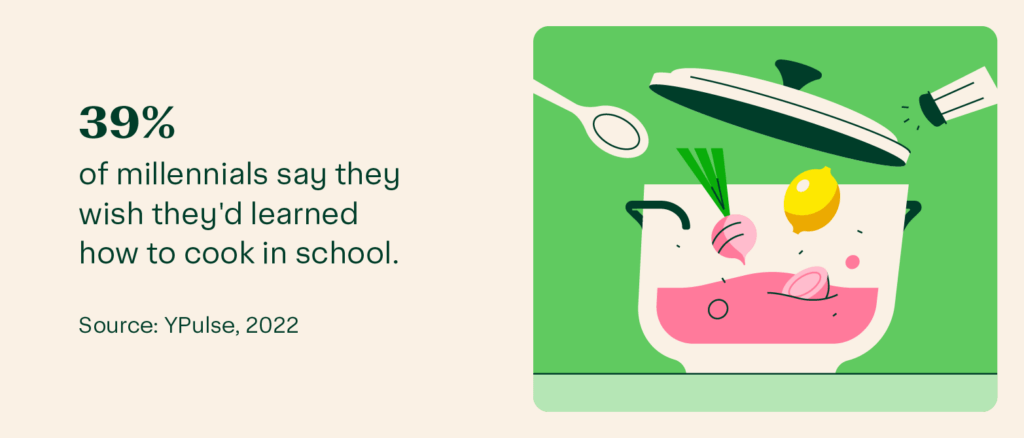
- 39% of millennials say they wish they’d learned how to cook in school.17
- Women spend an average of 57.2 minutes per day preparing food, while men spend an average of 41.5 minutes each day.17
- Americans spend an average of 46 minutes grocery shopping per trip.18
- The main motivators for meal prepping are saving time (26.9%), eating healthier (22.2%), and saving money (19.1%).16
- In the United States, food waste is estimated at between 30–40% of the food supply. Much of this waste could be avoidable if Americans understood the meaning of best buy and use by dates.19
- The average American spends $1,300 per year on food that ends up unused and tossed out.20
Fun facts about cooking
Tuck these cooking fun facts away to impress your friends and family at your next trivia match.
- Fugu (Japanese for pufferfish) is one of the most dangerous dishes to prepare and eat because it contains the neurotoxin tetrodotoxin, which is about 1,200 times more toxic to humans than cyanide and has no known antidote.21
- The longest cooking marathon world record, held by chef Lata Tondon, is 87 hours and 45 minutes.22
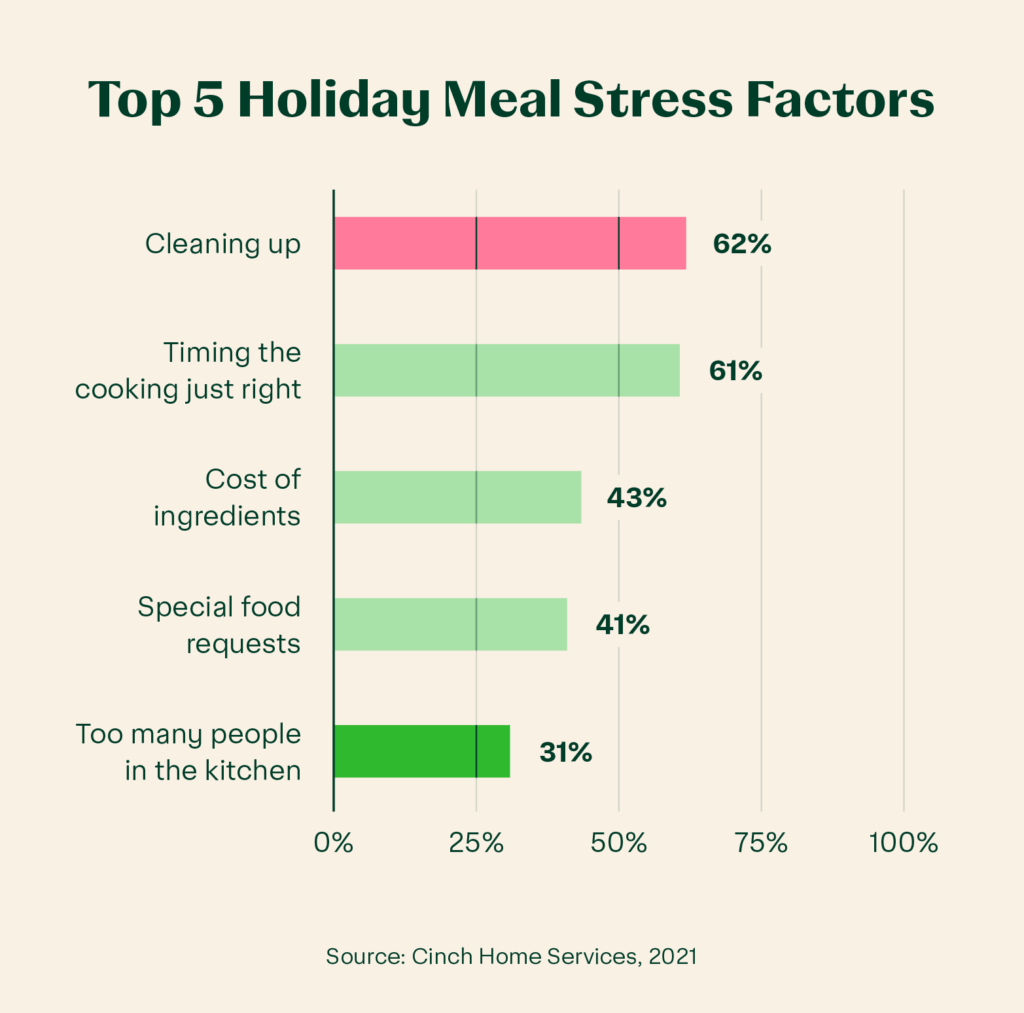
- In November 2021, 61.1% of respondents said that “timing the cooking just right” is what makes holiday meals stressful.23
- In November 2021, 62.8% of respondents said that mashed potatoes are the most essential Thanksgiving side dish.23
- As of March 2022, the Fourth of July is the most popular holiday for grilling out (54%), followed by Labor Day (47%) and Memorial Day (44%).7
- Holidays meals can rack up 3,000 calories, taking into account appetizers, the main course, beverages, and desserts — and that’s not accounting for seconds!24
- 44% of Americans who eat turkey on Thanksgiving prefer white meat compared to 20% that prefer dark meat.25
- Cereal, grains, and tubers (aka potatoes and yams) are the most common food staples in the world.26
- To reduce eye tearing when chopping onions, try chilling the onions for 30 minutes. Then, cut off the top and peel the outer layers leaving the root end intact. It’s the root end that contains the highest amount of sulphuric compounds that can cause your eyes to tear up.27
- In 2022, only 73% of Americans reported eating meat regularly. 12% reported being semi-vegetarian with another 10% being vegetarian or vegan.28
- 70% of Gen Z reported trying a snack after seeing it on social media in 2021.34
- While they’re often used interchangeably to refer to the meal you eat at night, dinner and supper originally weren’t the same. Dinner originally referred to a day’s main meal, which was often eaten mid-day. Supper referred to a smaller meal eaten in the evening.29
- Fresh white truffles, especially the Italian Alba winter truffle, are one of the most expensive foods in the world. One pound will cost you more than $4,000.3
Cooking statistics FAQ
Below, we dive into some of the most frequently asked cooking questions.
What percentage of the population can cook?
While many of us dabble in cooking, only a small portion of the population are professionally trained chefs. In 2020, there were an estimated 110,700 chef and head cook jobs in the United States.31
How much time do people spend in the kitchen?
The kitchen is a place to gather, eat and catch up with our loved ones, so it’s no wonder we spend quite a lot of our time there. In fact, a recent study published in 2022 found that Americans spend 400 hours in the kitchen each year. That boils down to 67 minutes per day.32
Is it really cheaper to eat at home?
According to U.S. News and World Report, cooking at home is cheaper than eating out — but there’s a catch. Recipes that call for expensive ingredients (such as spices, certain cheeses, and meats) can be more expensive than an away-from-home meal.33
However, choosing recipes that have affordable ingredients and checking your pantry before buying ingredients you may already have can cut down on the cost of your meal, making it more affordable than a restaurant dish.
Other tips for reducing the cost of eating at home include:
- Choose simple recipes with fewer ingredients
- Pick recipes where the main ingredient is less expensive, like a vegetable or pasta, and accent it with more expensive ingredients such as meats and cheeses
- Shop your pantry to see what you already have, and use those ingredients as inspiration to build recipes around

How do I start cooking more at home?
If you want to up your cooking game, it helps to start with a plan. Meal planning at the beginning of the week is a chance to choose recipes, grocery shop and prep ahead so that you have everything you need to get cooking. Leverage our grocery budget calculator to know exactly how much you’ll need to set aside for food buying every week or month.
Also, consider shifting your mindset about cooking from something you have to do to something you want to do. Turn on your favorite music, tune into a new podcast or start a new audiobook while you cook to keep you company in the kitchen and help you enjoy the act of cooking more.
Final thoughts to chew on
Lastly, if it’s a struggle to find time to make a grocery trip, consider a grocery delivery service. You’ll have all the ingredients you need for your dish delivered right to your door, saving you time and hassle.
We hope these cooking statistics shed light on America’s cooking habits and encourage you to whip up a meal for your loved ones soon. And if all this talk of cooking is making your stomach growl, we have a trove of ready-made meals that can be delivered right to your door!
Resources:
1 Acosta COVID Dining Journey: Eating at Home and Away From Home 2021
2 International Food Information Council COVID-19: March 2021 Report
4 Instacart 2021 Year in Groceries Report
5 The Family Dinner Project How COVID Changed Dinner 2021 Report
6 HPBA 2022 State of the Barbecue Industry Report
7 The Food Industry Association Grocery Shoppers Trends 2022
8 Statista Global Consumer Survey Food and Hot Drinks in the U.S. 2019 Report
9 Segmanta The Ultimate Food Survey 2020
10 International Food Information Council 2022 Food and Health Survey
11 Statista Global Consumer Survey Food and Nutrition in the U.S. 2021
13 2020 World Cooking Index Data
14 Morning Consult When and How Consumers Are Cooking in 2022
15 U.S. Department of Agriculture Economic Research Service Food-Related Time Use 2019 Report
16 MyProtein Americans Meal Prepping Habits 2022 Study
17 YPulse The Skills Gen Z & Millennials Wish They’d Learned 2022 Study
18 USDA Economic Research report, 2020
19 FDA Food Loss and Waste Data, 2021
20 William & Mary 2020 food waste study
23 Cinch Home Services Holiday Dining Survey 2021
24 Calorie Control Council 2020 Research
25 Instacart Third Annual Turkey Day Exposé: 2021
26 National Geographic Encyclopedia Entry
28 Kansas State University Meat Monitor January 2022 data
30 CNBC
31 U.S. Bureau of Labor Statistics
32 SWNS Digital: How Long Americans Spend in the Kitchen 2022 Survey
34 Statista Social Media Food Behavior of Generation Z 2021 data
Instacart
Instacart is the leading grocery technology company in North America, partnering with more than 1,400 national, regional, and local retail banners to deliver from more than 80,000 stores across more than 14,000 cities in North America. To read more Instacart posts, you can browse the company blog or search by keyword using the search bar at the top of the page. 17 Grocery List Categories to Make Shopping Easy
  How to Meal Plan: Step-by-Step Guide to Meal Planning
  How To Read Food Labels: Guide to Nutrition Labels

Most Recent in Planning & Prep

Planning & Prep
Recipe Converter Calculator: How To Scale Your Recipes
Found a great recipe but the portions are way too large? While leftovers are never a bad thing (cold pizza for breakfast, anyone?), we understand if you want to scale down your recipe. Our recipe…...
Apr 24, 2024
Planning & Prep
Dry to Cooked Pasta Calculator: How To Convert Pasta
There’s something so comforting about indulging in a large bowl of pasta — the al dente texture paired with your favorite sauce brings warmth with every bite. But do you feel like you’re making too…...
Apr 24, 2024
Planning & Prep
Guide to Grocery Delivery for Seniors
Hot and cold food products, ready-to-eat meals and personal care and health products should be available to everyone — including those who can’t make it to the store themselves. As you enter your golden years,…...
Apr 10, 2024