Instacart Ads
The Importance of Tracking Against Sales Velocity

Sales figures are key for brands to track and measure product performance. Category share, derived from this sales data, can also play an important role in giving you an idea of how you are competing.
That’s why it’s so important to be able to quickly access up-to-date sales and share data to understand how your brand and products are performing on Instacart. These insights are available to eligible brands through our self-service Ads Manager.
While sales and category share are important for all brands, for many whose distribution doesn’t put them in every retailer carrying products in their categories in the US and Canada, they introduce some noise into the signal on product performance.
This can make measuring the impact of advertising, promotions, and other marketing efforts tricky when looking at just sales and share data, as sales data doesn’t account for distribution.
A brand can be selling very well at the stores carrying its product but still have a relatively small amount of sales and category share. They could even be selling better at the stores carrying their products than brands with large category share and tremendous sales, but you won’t glean that from sales and share data alone.
Instead, you need a weighted velocity metric that can tell you how well your product sells when it’s available to consumers.
Introducing $ Sales Per Instacart Weighted Distribution
With this in mind, we developed a metric based on the Sales per Point of Distribution (SPPD) velocity metric that’s common in CPG data insights. Our metric, called $ Sales per Instacart Weighted Distribution, tells us the rate of sales, or ‘velocity’, weighted by distribution. With this metric you can understand the sales dollars your products generate factoring in its level of distribution. This provides a way of looking at how hard each point of distribution is working for you and how well your product could sell if it were more widely available.
Unlike the raw sales numbers, where a widely distributed product can have much larger sales numbers overall than the regional products it competes with, SPPD metrics reveal more about how your products are performing than sales and share data alone.
In fact, SPPD works best comparing products with varied distribution. The closer the distribution for any product is to 100% in a market, the closer the velocity and sales rankings will be. The product with top-ranked sales will have top-ranked velocity, too. Meaning you can focus just on your sales data.
For more information on both SPPD and velocity metrics in general, you can read this article from CPG Data Insights.
How is $ Sales per Instacart Weighted Distribution calculated?
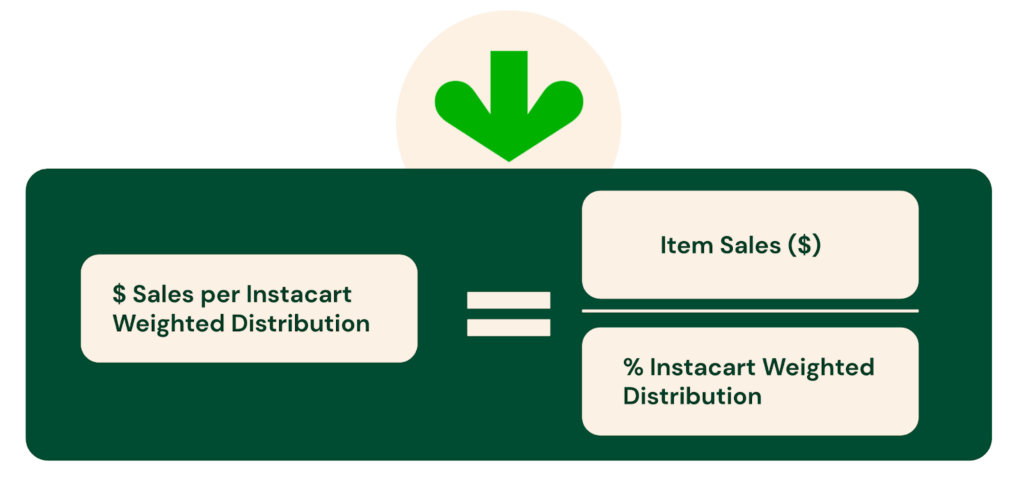
To calculate our new metric, we divide an item’s sales, in dollars, by its Instacart Weighted Distribution.
To make this calculation, we also need to know the Instacart Weighted Distribution for the product. Similar to an ACV weighted distribution, the Instacart Weighted Distribution looks at the total store sales, in dollars, where the item was sold to provide a view on how widely available the item is where the item category sales occur.
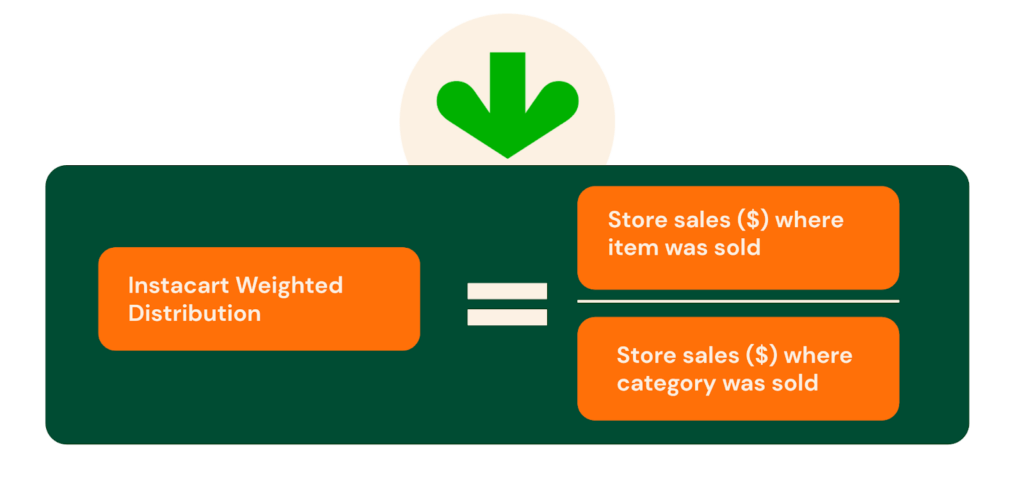
This metric helps to reduce noise by both disregarding stores where the item wasn’t sold and by revealing the quality of the distribution better than just a simple count of the number of stores selling a given item.
While knowing 10 stores are carrying your item does provide some information, a weighted distribution that speaks to the quality of that distribution is more useful. Consider these sales:
Item A is at ten stores. Those ten stores did $20,000 in sales. The sales ($) from all the stores where the item’s category was sold was $100,000.
Item B is only at five stores but those stores did $40,000 in sales. Item B is in the same category, so the store sales ($) where the category was sold is also $100,000.
Without doing any math we can see that while Item A has distribution to more stores, those stores are much smaller, in terms of sales, than the five stores where Item B has distribution. So the quality of distribution for Item B is better.
Running the numbers then, for Item A we get an Instacart Weighted Distribution of 0.2 (20k / 100k) or 20%. Meaning it was sold in stores that represent 20% of store sales where its category was available. And for Item B we get an Instacart Weighted Distribution of 0.4 (40k / 100k) or 40%.
This example reveals the importance of this weighted distribution metric: Item B has double the weighted distribution even though it has distribution to only half the number of stores as Item A, because those stores had double the sales in the category.
The impact of the weighted distribution carries through to the $ Sales per Instacart Weighted Distribution velocity metric as well. If Item A and Item B both had sales of $500, Item A’s velocity would be 25 (500/20) and Item B’s would be 12.5 (500/40).
These numbers reveal an example of the noise the velocity metric helps to remove from the signal on product performance. Comparing the metrics of Item A and Item B we see that although they have the same dollar amount of sales, they do not have identical performance:
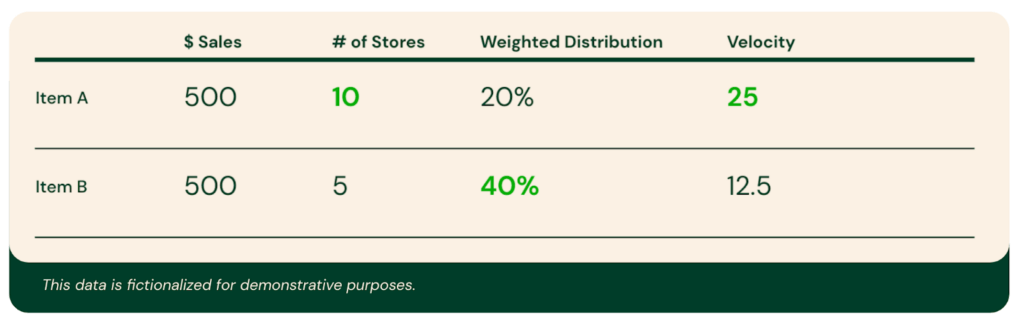
Item A is in more stores, but since those stores contribute to only 20% of the total category sales on Instacart, Item A has an Instacart Weighted Distribution of 20%, half of Item B’s distribution.
From this we can see that although Item A has the same sales, and is in more stores, Item B actually has the better-quality distribution. It is in the more important stores, in terms of which stores on Instacart have more of the category sales.
As a result, the velocity metric tells us that Item A has a greater velocity, or rate of sales, than Item B. Even though its quality of distribution is less than Item B’s, it has the same dollar amount of sales.
This presents different information about the performance of these two items on Instacart and a path forward for each. For Item A, you would want to improve its distribution — if it could retain the higher velocity and get better distribution, sales would grow. While for Item B, with an Instacart Weighted Distribution of 40% there is still plenty of room for its distribution to grow, but relative to Item A, it has half the rate of sales suggesting the path forward isn’t necessarily getting in more stores, but improving performance at its current distribution.
$ Sales per Instacart Weighted Distribution in the Real World
It’s important to look at the changes to $ Sales per Instacart Weighted Distribution over time, rather than isolated in a single point in time. This helps to remove the noise of seasonality or limited-time promotions from the signal. And because we wanted to focus on products that had a degree of variability in distribution, we decided to examine challenger brands that were actively promoting their products on Instacart.
We pulled data on over 130 products from 29 different brands with a strong investment rate — that is, brands with an ad spend equal to, on average, 20% of their total sales on Instacart. We focused on products with at least $35k in sales and 250 days of sales for both 2020 and 2021 and calculated their $ Sales per Instacart Weighted Distribution for both 2020 and 2021.
The vast majority of these 130 products across 31 different categories saw double-digit growth YoY in this velocity metric, with a few reaching triple-digit growth YoY. On average, the products had a YoY growth rate in $ Sales per Instacart Weighted Distribution of 48%.
Plotting the number of products against their YoY growth rate in $ Sales per Instacart Weighted Distribution, we see this distribution—
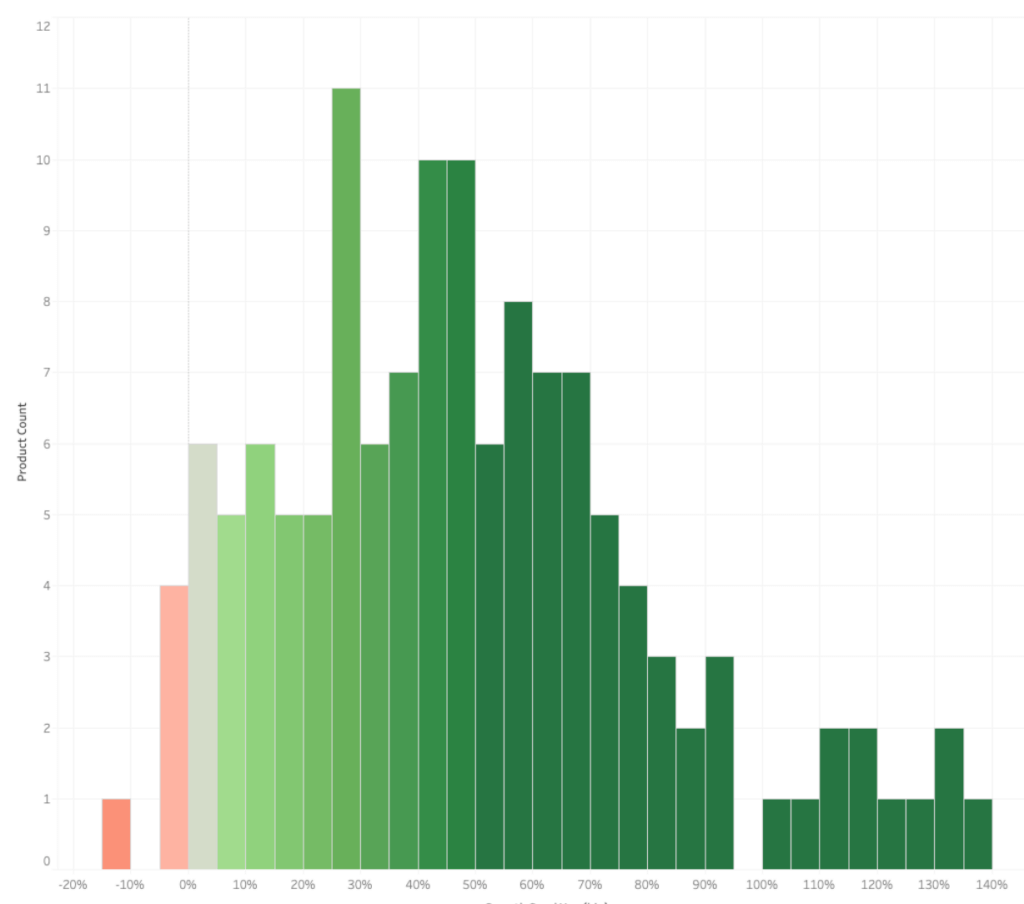
While there are still too many variables that go into a product’s YoY velocity growth to show a causal link between investment rate and velocity growth, examining the velocity of your products does remove a lot of the noise that can be present in other performance metrics. In our data, products from challenger brands with a healthy investment rate did return, on average, promising results.
Several of our brand partners whose products were included in the study are excited about both the availability of this metric, and the results they’ve seen.
Next steps for eligible brand partners
We’re providing this new metric to all eligible brand partners with a strong investment rate. If you are curious to know how your sales velocity has grown year-over-year contact your Instacart representative today. We can help you to understand how your points of distribution are working for you.
Instacart
Instacart is the leading grocery technology company in North America, partnering with more than 1,400 national, regional, and local retail banners to deliver from more than 80,000 stores across more than 14,000 cities in North America. To read more Instacart posts, you can browse the company blog or search by keyword using the search bar at the top of the page. How Consumers Shop on Instacart – Unique Consumer Behavior
  Advertising on Instacart 101: Where Do My Ads Show?
  How Instacart Ads provides value today and in the cookieless future

Most Recent in Instacart Ads

Instacart Ads
Instacart Launches Target ROAS and New Acquisition Objective
New functionality brings increased control and efficiencies to reach new audiences At Instacart, we use an objective-based framework to organize our ad formats for advertisers creating new ad campaigns. Because our different ad formats are…...
Apr 16, 2024
Instacart Ads
Saffron Road Campaign Generates 68% Incremental Sales Lift
Saffron Road is America’s largest brand in “Better for You” animal protein-based frozen dinners. They deliver clean-label, high-quality, and ethically sourced products that respect cultural traditions from around the world. Saffron Road was an early…...
Apr 9, 2024
Instacart Ads
Tender Belly Increases New to Brand Customers 144%
Founded by brothers Shannon and Erik Duffy, Tender Belly creates ‘crazy tasty’ pork products like bacon, ham, pork sausages, using ethically raised pigs. Their pork contains no antibiotics, hormones, MSG, or high fructose corn syrup.…...
Mar 21, 2024