Instacart Ads
Instacart Advertising 101: Analytics. Driving with Directions
In the Advertising on Instacart 101 series, we introduce readers to Instacart Ads, look at some key concepts, and talk about the value they can provide brands of all sizes — from emerging challenger brands to the very largest category leaders.
In this article we talk about the importance of analytics when running digital ads, what key metrics you should be regularly examining, and what they can tell you about the effectiveness of your ad campaigns.
Just like you wouldn’t drive somewhere new without directions, you can’t run high-performing ad campaigns without proper guidance. And with technology, both are getting easier — nowadays your smartphone tells you which turns to make and how long it’ll take to get there, while digital advertising tools measure and analyze multiple aspects of ad campaign performance.
In the case of Instacart Ads, our self-service tool, Ads Manager, provides brands with many different metrics on overall campaign performance, as well as analytics on specific ad groups, products, and keywords. The tool can graph many of the metrics across time frames you selected — last 7 days, last week, last month, and so on.
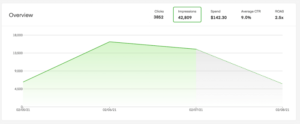
*Example data from a test campaign
Here are some of the key metrics you can find on Ads Manager:
- Impressions. The number of times your ad appeared on the Instacart Marketplace. Since Instacart Ads uses a 2nd-price auction model, one of the best ways to gauge how many placements you’re winning is by looking at this metric — the more you win, the higher the number of impressions.
- Clicks. The number of times consumers clicked on one of your ads. The more clicks, the better. You should see the number of clicks rise and fall roughly in-line with the impressions.
- Average CTR. The average clickthrough rate (CTR) of your ads describes what percentage of times consumers click on your ad whenever it appears. While there are many reasons for a consumer to decide to click on an advertised product in the Marketplace, you can get a sense of how often consumers are engaging with your ads by looking at their CTR. Winning top shelf placements, for example, can be an effective approach to increasing CTR as consumers engage most with the first items they see.
- ROAS. The return on ad spend (ROAS) helps to put your ad performance in financial terms. ROAS helps advertisers understand how the sales their ads are driving compare to their investment level. Along with the average CTR, ROAS helps to describe how your ads are performing.
- Attributed Sales. The dollar amount of sales of a particular product attributed to an ad. Put another way, this is the amount of sales we believe your ad generated.
- Average CPC. The average cost-per-click (CPC) you paid for the clicks on your ads. With our 2nd-price auction model, you’re only charged the minimum amount needed to beat the next best competitor. So while you can end up paying less than your maximum bid, you’ll never pay more. Your average CPC tells you the rate at which you’re spending your ad budget.
While each metric offers insight into different aspects of your ad campaigns, it’s important to consider these metrics holistically. Attempting to measure ad performance off of a single key metric can be misleading.
For example, a campaign with a high ROAS and decent average CTR, but a low number of impressions and clicks, likely points to a missed opportunity to grow sales with a more competitive bid and higher budget. While it’s tempting to see a high ROAS and think ‘job done,’ examining all the metrics can tell you otherwise — in this case, a high ROAS could simply be the result of a low ad spend. With a more competitive bid you could end up spending more, lowering the ROAS, but winning better placements, getting seen by more consumers, and growing sales.
Which brings up another point about reviewing your metrics holistically. And that is: not all brands have the same goals. So no one metric can be used to determine success. If your goal is to have a newer product seen by as many consumers as possible, then the number of impressions matters more to you than the ROAS. Or if your goal is to capture net-new consumers and then retain them longer term, you might consider bidding higher to win the top placements even though this lowers your ROAS.
Take all the analytics and metrics together and you’ll see a much clearer picture.
How often should I review my analytics?
Instacart Ads run in a highly dynamic environment with new retailers being added to the Marketplace, new consumers signing up, and new brands advertising new products all the time. Any of these events can have a sizeable impact on how your ads perform — a new retailer coming on to the Marketplace can attract a whole new segment of consumers, which bring new behaviors, while a brand launching a new ad campaign can increase competition in the auctions your ads participate in.
So the simplest answer is as often as you can. Taking five minutes each day to log on to Ads Manager to review analytics is a great habit to get into. Not only will you be well informed but you’ll be able to spot trends and understand what a normal day, week, or month looks like in the life of your campaigns and what requires some fine-tuning.
And that covers the available analytics and metrics on Ads Manager and what you can learn from them. In a later post we’ll cover Instacart Ads reporting by looking at the different reports available to brands that advertise with us and what they can be used for. And we’ll also be covering ways to optimize your campaigns and the power of the Ads Manager’s recommendations.
Advertise with us to get in front of consumers when they’re searching for products like yours on the Instacart Marketplace. For more information and to get started, visit ads.instacart.com.
Instacart
Instacart is the leading grocery technology company in North America, partnering with more than 1,400 national, regional, and local retail banners to deliver from more than 80,000 stores across more than 14,000 cities in North America. To read more Instacart posts, you can browse the company blog or search by keyword using the search bar at the top of the page. How Consumers Shop on Instacart – Unique Consumer Behavior
  Advertising on Instacart 101: Where Do My Ads Show?
  How Instacart Ads provides value today and in the cookieless future

Most Recent in Instacart Ads

Instacart Ads
Fire & Smoke Society Spices Up Sales with Instacart Ads
Fire & Smoke Society, the makers of spices, rubs, seasoning, and sauces with playful names like ‘Potato Slayer’ and ‘Mayor Of Rub Town’ got their start back in 2018. Originally, the spices and seasonings were…...
Apr 17, 2024
Instacart Ads
Instacart Launches Target ROAS and New Acquisition Objective
New functionality brings increased control and efficiencies to reach new audiences At Instacart, we use an objective-based framework to organize our ad formats for advertisers creating new ad campaigns. Because our different ad formats are…...
Apr 16, 2024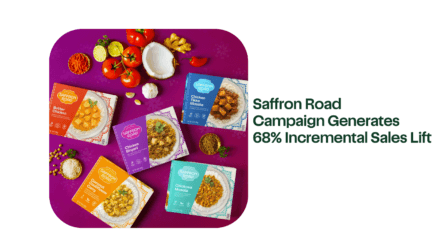
Instacart Ads
Saffron Road Campaign Generates 68% Incremental Sales Lift
Saffron Road is America’s largest brand in “Better for You” animal protein-based frozen dinners. They deliver clean-label, high-quality, and ethically sourced products that respect cultural traditions from around the world. Saffron Road was an early…...
Apr 9, 2024