A common challenge when building good software is: how do you measure your product quality at scale? What feedback would you expect to get when you’re building good software?
With hundreds of Instacart Enterprise deployments per day impacting dozens of retailers, it is impossible to verify everything by hand. To measure and monitor Enterprise software quality, the Enterprise Test Automation team has built Mango, which is an API test automation solution embedded across all of our development, UAT, and production environments.
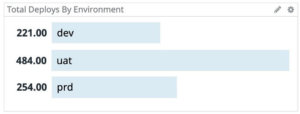
Daily deployment counts per environment
In this post, we’ll dive into the metrics collection and reporting workflows we built.
Development Workflow
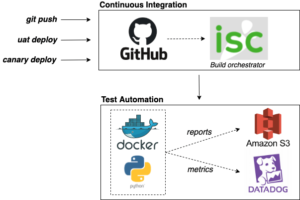
An important part of measuring product quality is to embed running the automation suite throughout the entire Software Development Life Cycle (SDLC). Test runs are triggered each time engineers commit product code, but they are also triggered by every deployment including the final deployment to production. At Instacart, we also run tests on an hourly basis since a lot of test scenarios are driven by the product catalog which changes over time. These frequent test runs help us capture, collect, and report on software quality metrics.
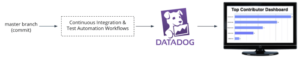
GitHub code changes and deployments trigger the test automation workflow
By incorporating test runs into all of these workflows, we can also capture the frequency of test failures based on the environment. This allows us to set goals around test failures and bugs: we expect the number of bugs and test failures to decrease from the highest count, to a very low number (or none!) by the time our code reaches production canary services. If for some reason this metric is reversed then it’s likely that not enough bugs are being caught early during Pull Requests, which tells us we should be focusing on improving the local development workflow.
Metrics We Collect
We aim to instrument every part of the test process so that we can publish these metrics and build team and organization goals around them. Below is a list of a few key metrics that we capture
Test Status: How many test cases passed, failed, xfailed, xpassed, or were skipped. This is our most fundamental metric — in particular how many tests have failed or xfailed. When tests are xfailed, there is either a bug causing the failure or the test code itself is outdated. This is a great way to measure tech debt.
Test Duration: We aggregate by environment, team, and feature. The goal is to continually reduce the average duration per test case to maintain a highly efficient test suite. Using this metric, we are also able to identify which tests are the slowest, which gives us ideas on what code we can focus on to speed up our systems.
Bugs in JIRA: How many bugs are reported in JIRA. When we investigate test failures, we create bugs in JIRA and attach them to the automation test failure. This is also a good indicator of technical debt and overall quality, and we want to keep this metric low.
Test Case Counts: We aggregate this number by team, feature, and contributors. As mentioned earlier, this allows us to give recognition to top teams and people that contribute tests, while also allowing us to identify and encourage change on teams with no tests.
Code Coverage: Lines of code coverage, aggregated by platform (API, UI, etc.). By deploying an instrumented version of the product codebase, we can collect and track code coverage metrics. This allows us to see which product areas have no tests at all, and also which code is completely unreachable! It’s really common across many companies that code changes get merged which are never actually executed in the deployed application.
Static Analysis Reports: Automatically generated metrics, which include cyclomatic complexity, average lines per class, average lines per function, etc. We do not strictly enforce limits here — we use this to provide visibility to our engineering teams, which helps to proactively reinforce good development habits.
Quality Dashboards
All these metrics serve one primary purpose: dashboards! Dashboards allow us to add alerts, notify the right stakeholders, and, most importantly, create measurable goals and hold ourselves accountable to maintaining a high-quality product. Collecting and publishing test automation metrics allows our Enterprise Engineering teams to build comprehensive dashboards that give us a good snapshot of our product quality.
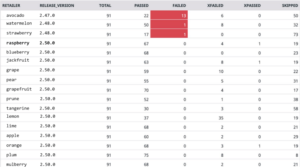
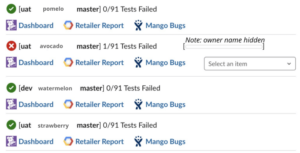
Aggregate test results across multiple retailer environments and versions. Retailer names and release versions replaced with fruits! 🙂
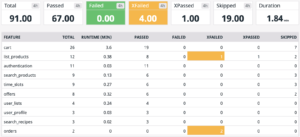
Since metrics are published to Datadog at test case granularity, we can drill down from the high-level overview shown above into test results by feature and even by test case. These metrics are great because in situations where a test case fails in just one environment the root cause is typically a specific integration issue, while a test case failure across the board is a good indicator that bad code made it through to a production deployment.
Automation test results, aggregated by feature
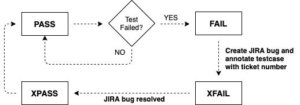
Automation Test Status and Lifecycle
Instacart’s Mango framework leverages pytest’s test case states and attaches a meaning for each state. The diagram below illustrates each of these states, and also the actions required to move between states:
We find that these states reflect a very typical process in our SDLC. Capturing these states also provides us a way to measure how many tests need to be worked on (those in FAIL status), and also a way to measure technical debt, (a count of tests in XFAIL status).
Acting on Automation Failures
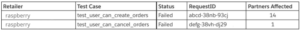
When building our quality dashboards, the most important thing we consider is “how is the information being displayed actionable?” If a dashboard exists but no actions can be taken to investigate failures and improve the metric, then it’s not really helpful to investigate the issue. With Instacart Enterprise, Mango attaches a request ID header for every API request sent, which is then published to Datadog for any test case that failed:
For each failed test case, measure how many retailers are affected, and also the API request ID causing the test failure for easy tracing and investigation
To further improve the feedback cycle, test owners are notified via Slack each time a test run fails. The appropriate on-call team member is pinged based on the test failure, and we strive to provide enough reporting information so that a failure can be troubleshoot-ed without the need to re-run the tests again locally:
Slack messages to notify stakeholders that their tests have failed
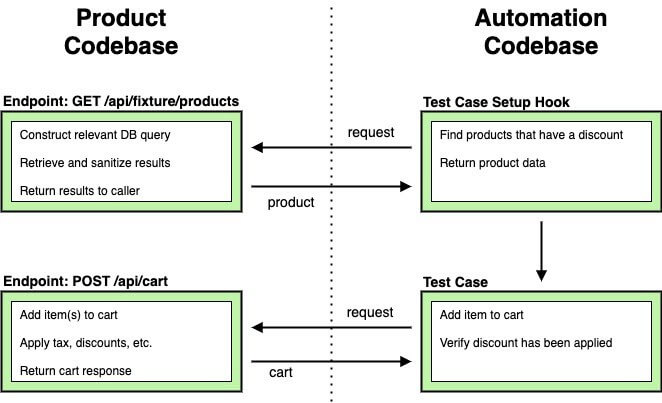
Test Endpoints in Product Code
We quickly realized that black box testing our API was an unmanageable approach. For example, what if we need to automate a test case that verifies if a $2 for 1 coupon offer is correctly applied to your cart? In an extreme example, a retailer may have 10 stores and only 1 product discount, so how could we quickly find such a product?
A common solution is to run a query against a Product Catalog DB or ElasticSearch instance, but this doesn’t scale well. The biggest drawback to this approach is that test code is now tied to your infrastructure and schemas. The more systems you have tests for, the more integrations you need to manage. Maintaining sensitive credentials, database connections, etc. are dependencies too big to introduce to our test framework.
Example automation workflow to verify a product discount is applied to a user’s cart item
We came up with a system which allows our tests to interact directly with our data sources using an endpoint like GET /api/fixtures/products. The test setup methods call the endpoint with a few parameters based on a particular scenario, receive products for their scenario, and carry on with the test. This is convenient because the product code already has all dependencies in place to serve such a request, and the endpoint is also reusable for UI automation tests.
Rewarding Automation Contributors
Driving adoption among product teams is a critical part of any test automation framework. It is very important to us to embed team and product ownership into automation tests and also to reward our top contributors. A little positive reinforcement goes a long way, and we want to make our engineers feel good about contributing to automation tests by rewarding them, rather than making it feeling like a chore with no positives.
A dashboard around the office is a great way to raise awareness, drive adoption and recognize team members!
Before each merge into master, we capture the github usernames of engineers who added tests and their corresponding product teams. This allows us to give “kudos” to teams that are staying on top of automation efforts, while focusing on framework support and driving adoption for lower-contributing teams. A great way to create an environment of ongoing recognition is to show a monthly snapshot of the dashboard at an all hands meeting as well on a mounted monitor at the office.
As Mango matures, driving adoption across the organization is critical. Everyone is a contributor to quality and that’s the attitude and culture we have been encouraging at Instacart. As a new Software Engineer joining the company, you can expect an onboarding workshop scheduled with a Test Automation team member in which you will cover our best quality practices and how to contribute to our automation efforts. The Test Automation team has made it easy for engineers to see how they contribute to quality, and we are now driving Mango’s usage across multiple product areas within Instacart!
Final Thoughts
As Instacart continues to improve our automated test coverage, we need to remind ourselves that it’s not just about the number of test cases — we need to measure our progress and set goals against our observed metrics. A medium to large unorganized test suite adds only short-term value to the organization; it eventually gets scrapped or rewritten because no one knows how much is really being tested and the test code base (as well as the code base being tested!) is too large to easily comprehend. Automation becomes a powerful tool to drive good quality and delivers long term value only after we start capturing meaningful metrics and delivering actionable reporting from our test suites.
Want to build tools and processes like these? Our Enterprise engineering team is hiring! Visit our careers page to explore our current openings.
Dragan Rakas
Dragan Rakas is a member of the Instacart team. To read more of Dragan Rakas's posts, you can browse the company blog or search by keyword using the search bar at the top of the page.
Author: Ben Bader The universe of the current Large Language Models (LLMs) engineering is electrifying, to say the least. The industry has been on fire with change since the launch of ChatGPT in November of…...
Authors: Han Li, Sahil Khanna, Jocelyn De La Rosa, Moping Dou, Sharad Gupta, Chenyang Yu and Rajpal Paryani Background About a year ago, we introduced the first version of Griffin, Instacart’s first ML Platform, detailing its development and support for end-to-end ML in…...


 Building Instacart Meals
  7 steps to get started with large-scale labeling